July 15, 2025 a 03:16 pm


Utility Stocks - Performance Analysis
The utilities sector has demonstrated varied performance over recent periods, reflecting both market resilience and volatility. With the increasing focus on renewable energy and regulatory changes, utility stocks show diverse trajectories, indicating shifts in investor sentiment. This analysis will break down these stocks' performances over the past week, month, and three months, identifying key trends and potential investment opportunities.
📊 Utility Stocks Performance One Week
| Stock | Performance (%) | Performance |
|---|---|---|
| CEG | 4.17% | |
| NEE | 3.52% | |
| PEG | 1.70% | |
| D | 1.59% | |
| SO | 1.56% | |
| DUK | 1.39% | |
| AEP | 1.03% | |
| EXC | 1.01% | |
| SRE | 0.32% |
📊 Utility Stocks Performance One Month
| Stock | Performance (%) | Performance |
|---|---|---|
| CEG | 9.75% | |
| D | 3.15% | |
| SO | 2.59% | |
| PEG | 2.51% | |
| AEP | 2.13% | |
| DUK | 0.96% | |
| SRE | 0.72% | |
| NEE | 0.67% | |
| EXC | 0.49% |
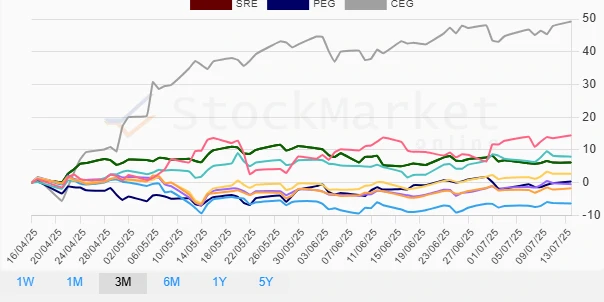
📊 Utility Stocks Performance Three Months
| Stock | Performance (%) | Performance |
|---|---|---|
| CEG | 49.25% | |
| NEE | 14.46% | |
| D | 7.92% | |
| SRE | 6.13% | |
| SO | 2.74% | |
| PEG | 0.39% | |
| AEP | -0.46% | |
| DUK | -1.69% | |
| EXC | -6.40% |
📈 Summary
This comprehensive analysis of utility stocks reveals distinct performance narratives over varied timeframes. Notably, the three-month horizon underscores CEG's substantial growth amid sector-wide fluctuations. Conversely, EXC's significant decline suggests underlying challenges. Investment strategies should incorporate these insights, recognizing CEG's potential while remaining cognizant of EXC's risks. Continuous market monitoring is crucial, with a focus on policy shifts and economic indicators impacting the utilities sector.
Smart Data Insight
Master the Perfect Entry & Exit for this Stock
Don't leave your profits to chance. Historically, this stock follows specific seasonal patterns that institutional traders use to maximize returns.
- ✅ Identify the "Golden Buying Window"
- ✅ Avoid high-risk correction cycles
- ✅ Backtested data from the last 20+ years