October 14, 2025 a 03:16 pm


Utility Stocks - Performance Analysis
The Utility sector has demonstrated varying degrees of performance across different timeframes, reflecting both market resilience and challenges. Our detailed analysis of the largest utility stocks over the past week, month, and three months provides insights into current trends, identifying leaders and laggards in the market. This analysis will support investors in making informed decisions, backed by quantifiable performance metrics.
📊 Utility Stocks Performance One Week
| Stock | Performance (%) | Performance |
|---|---|---|
| CEG | 6.40 | |
| SO | 1.74 | |
| PEG | 1.53 | |
| D | 0.79 | |
| NEE | 1.32 | |
| DUK | 0.44 | |
| EXC | 0.14 | |
| AEP | -1.15 | |
| SRE | -3.02 |
🗓️ Utility Stocks Performance One Month
| Stock | Performance (%) | Performance |
|---|---|---|
| CEG | 17.19 | |
| NEE | 16.54 | |
| SRE | 8.51 | |
| EXC | 7.81 | |
| AEP | 6.62 | |
| SO | 6.19 | |
| DUK | 3.41 | |
| D | 2.24 | |
| PEG | -1.03 |
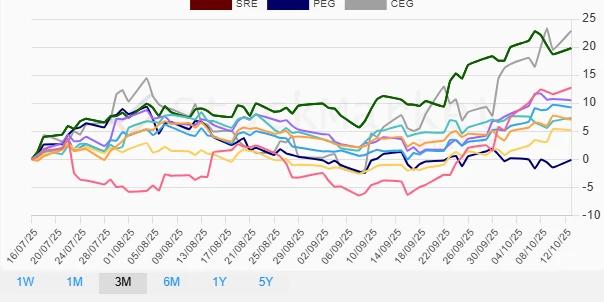
📅 Utility Stocks Performance Three Months
| Stock | Performance (%) | Performance |
|---|---|---|
| CEG | 22.88 | |
| SRE | 19.79 | |
| AEP | 10.53 | |
| EXC | 9.25 | |
| D | 7.38 | |
| DUK | 7.05 | |
| NEE | 12.75 | |
| SO | 5.16 | |
| PEG | -0.11 |
💡 Summary
Over the evaluated periods, CEG has consistently emerged as a top performer, indicating strong market positioning. Conversely, SRE's volatility, particularly over the week, reflects underlying challenges. Attention should be paid to top turning points such as DUK's steady performance and PEG's minor decline, potentially suggesting shifts in market sentiment. Forward-looking investors should consider diversifying within the sector, leveraging top performers while remaining cautious of underperformers for balanced portfolio growth.
Smart Data Insight
Master the Perfect Entry & Exit for this Stock
Don't leave your profits to chance. Historically, this stock follows specific seasonal patterns that institutional traders use to maximize returns.
- ✅ Identify the "Golden Buying Window"
- ✅ Avoid high-risk correction cycles
- ✅ Backtested data from the last 20+ years