
May 13, 2025 a 03:16 pm


Utility Stocks - Performance Analysis
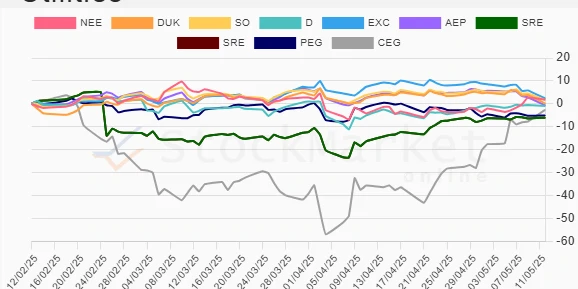
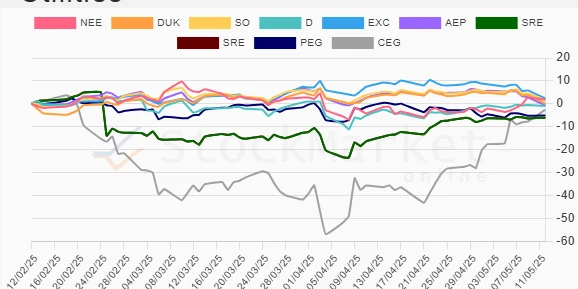
In this report, we delve into the performance of some of the largest utility stocks over short-term periods: one week, one month, and three months. As always, the utilities sector is of particular interest due to its offering of stability and dividends. Our analysis reveals distinct performers and underperformers, indicating possible shifts in investor sentiment and economic undercurrents within the sector.
Utility Stocks Performance One Week
The analysis of the utility stocks over the past week highlights significant volatility with notable diverging performances. CEG leads with a gain of 4.69%, while AEP lags considerably at -6.10%. The divergence suggests varying responses to market stimuli.
| Stock | Performance (%) | Performance |
|---|---|---|
| NEE | 4.69 | |
| CEG | 4.26 | |
| SRE | 0.80 | |
| D | 0.31 | |
| PEG | -0.87 | |
| SO | -3.77 | |
| DUK | -5.84 | |
| EXC | -5.87 | |
| AEP | -6.10 |
Utility Stocks Performance One Month
Over the past month, utility stocks have shown some resilience, with CEG soaring at 33.03%. Conversely, AEP and PEG notably underperformed, edging the sector towards caution.
| Stock | Performance (%) | Performance |
|---|---|---|
| CEG | 33.03 | |
| SRE | 10.35 | |
| NEE | 6.02 | |
| D | 4.05 | |
| SO | -2.19 | |
| DUK | -2.46 | |
| AEP | -3.34 | |
| PEG | -3.70 | |
| EXC | -5.12 |
Utility Stocks Performance Three Months
The three-month window portrays a challenging phase for utility stocks. EXC emerges with a modest gain of 2.33%, while SRE suffers a significant loss at -6.01%. This prolonged underperformance hints at sectoral pressures persisting beyond short-term market turbulence.
| Stock | Performance (%) | Performance |
|---|---|---|
| EXC | 2.33 | |
| NEE | 1.84 | |
| SO | 1.65 | |
| DUK | 0.15 | |
| AEP | -0.66 | |
| D | -0.96 | |
| CEG | -2.62 | |
| PEG | -5.09 | |
| SRE | -6.01 |
Summary
The utility sector is exhibiting marked variability in performance as shorter-term dynamics reflect recent market conditions. While stocks like CEG have shown strong resilience and growth, others like AEP and SRE present challenges. Investors should carefully assess the underlying factors contributing to these performances and consider diversification within their portfolios. The longer-term underperformance of many stocks signals possible structural adjustments required in the sector.
Smart Data Insight
Master the Perfect Entry & Exit for this Stock
Don't leave your profits to chance. Historically, this stock follows specific seasonal patterns that institutional traders use to maximize returns.
- ✅ Identify the "Golden Buying Window"
- ✅ Avoid high-risk correction cycles
- ✅ Backtested data from the last 20+ years