
August 11, 2026 a 03:16 pm


Utility Stocks - Performance Analysis
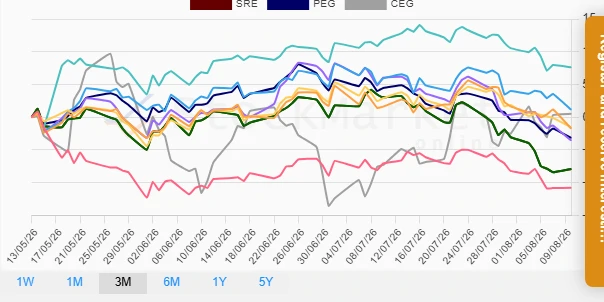
📊 The utilities sector, traditionally viewed as a stable investment area, has shown varying performance over the past timeframes. While some stocks have defied broader trends to deliver positive returns, others have struggled amid shifting market conditions. This analysis examines performance over the 1-week, 1-month, and 3-month periods to identify key trends and insights, providing guidance for future investment decisions.
Utility Stocks Performance One Week
| Stock | Performance (%) | Performance |
|---|---|---|
| CEG | 1.25 | |
| PEG | -2.24 | |
| SO | -2.06 | |
| DUK | -2.46 | |
| SRE | -2.72 | |
| EXC | -2.92 | |
| NEE | -2.88 | |
| D | -3.00 | |
| AEP | -4.34 |
Utility Stocks Performance One Month
| Stock | Performance (%) | Performance |
|---|---|---|
| CEG | 7.83 | |
| DUK | -3.35 | |
| NEE | -3.70 | |
| D | -4.16 | |
| SO | -4.46 | |
| PEG | -7.62 | |
| EXC | -4.81 | |
| AEP | -9.59 | |
| SRE | -10.94 |
Utility Stocks Performance Three Months
| Stock | Performance (%) | Performance |
|---|---|---|
| D | 7.62 | |
| EXC | 1.12 | |
| CEG | 0.52 | |
| SO | -1.55 | |
| DUK | -1.73 | |
| PEG | -3.16 | |
| AEP | -3.57 | |
| SRE | -7.91 | |
| NEE | -10.77 |
Summary
💡 Over the respective time frames, it is evident that the utilities sector has faced a challenging landscape, with only a few stocks like CEG consistently delivering positive performances across all analyzed periods. In contrast, stocks such as AEP and SRE have shown notable negative trends, especially over the extended three months. The volatile nature of these stocks highlights the sector's sensitivity to broader economic factors. Investors should remain cautious, leveraging diversified holdings to mitigate potential downsides while seizing opportunities from top performers.
Smart Data Insight
Master the Perfect Entry & Exit for this Stock
Don't leave your profits to chance. Historically, this stock follows specific seasonal patterns that institutional traders use to maximize returns.
- ✅ Identify the "Golden Buying Window"
- ✅ Avoid high-risk correction cycles
- ✅ Backtested data from the last 20+ years