February 10, 2026 a 03:16 pm


Utility Stocks - Performance Analysis
The utility sector has demonstrated varied performances across different time frames. While some companies show resilience with positive growth, others struggle with declines. A detailed analysis will reveal the top performers and underperformers, offering insights into sector trends and driving factors.
📊 Utility Stocks Performance One Week
| Stock | Performance (%) | Performance |
|---|---|---|
| CEG | 1.85 | |
| D | 1.52 | |
| NEE | 0.75 | |
| SRE | 0.55 | |
| AEP | 0.37 | |
| DUK | 0.05 | |
| EXC | -0.07 | |
| PEG | -0.44 | |
| SO | -0.83 |
📊 Utility Stocks Performance One Month
| Stock | Performance (%) | Performance |
|---|---|---|
| NEE | 11.47 | |
| D | 7.40 | |
| DUK | 4.20 | |
| AEP | 3.61 | |
| PEG | 3.25 | |
| SO | 2.77 | |
| EXC | 1.63 | |
| SRE | -1.35 | |
| CEG | -21.68 |
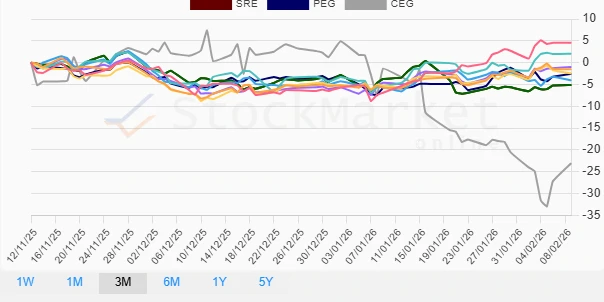
📊 Utility Stocks Performance Three Months
| Stock | Performance (%) | Performance |
|---|---|---|
| NEE | 4.57 | |
| D | 2.03 | |
| AEP | -1.01 | |
| DUK | -1.54 | |
| PEG | -2.54 | |
| SO | -2.51 | |
| EXC | -4.04 | |
| SRE | -5.11 | |
| CEG | -23.04 |
🔍 Summary
Across the analyzed periods, CEG consistently appears as the most underperforming stock, reflecting challenges it faces within the utilities sector. Conversely, NEE has demonstrated robust growth particularly in the one-month and three-month windows, positioning itself as a resilient performer. This varied landscape indicates strategic opportunities for those investing in the utilities domain, but also underscores the caution needed when aligning portfolios.