September 09, 2025 a 03:16 pm


Utility Stocks - Performance Analysis
📊 This comprehensive utility stocks analysis explores the sector's performance over 1 week, 1 month, and 3 months. Key trends are identified, evaluating both the top performers and underperformers in the field. The insights provided aim to illuminate potential investment opportunities or pitfalls within the utility sector.
Utility Stocks Performance One Week
| Stock | Performance (%) | Performance |
|---|---|---|
| EXC | -0.80 | |
| SO | -1.38 | |
| DUK | -1.42 | |
| PEG | -1.99 | |
| D | -2.02 | |
| AEP | -2.32 | |
| CEG | -2.73 | |
| NEE | -4.01 | |
| SRE | -4.26 |
Utility Stocks Performance One Month
| Stock | Performance (%) | Performance |
|---|---|---|
| SRE | -2.71 | |
| NEE | -3.52 | |
| DUK | -4.13 | |
| SO | -4.13 | |
| AEP | -4.43 | |
| EXC | -5.12 | |
| D | -6.33 | |
| PEG | -8.82 | |
| CEG | -11.41 |
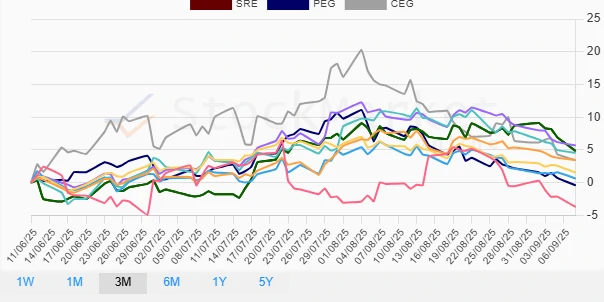
Utility Stocks Performance Three Months
| Stock | Performance (%) | Performance |
|---|---|---|
| PEG | -0.42 | |
| EXC | 0.64 | |
| SO | 1.55 | |
| CEG | 3.41 | |
| DUK | 3.45 | |
| D | 4.56 | |
| SRE | 4.85 | |
| NEE | -3.71 | |
| AEP | 5.67 |
Summary
💡 In summary, the utilities sector demonstrated varied performance across the analyzed timeframes. Over the last week, most utility stocks exhibited a downturn, but shorter-term trends might not reflect longer-term performance. A monthly overview highlights extensive declines, with CEG and PEG struggling the most. However, over three months, several stocks showed resilience, notably AEP and SRE. These insights suggest cautious optimism might be prudent, focusing on stocks displaying long-term stability. Investors should be advised to closely monitor economic and regulatory influences that could impact this sector.
Smart Data Insight
Master the Perfect Entry & Exit for this Stock
Don't leave your profits to chance. Historically, this stock follows specific seasonal patterns that institutional traders use to maximize returns.
- ✅ Identify the "Golden Buying Window"
- ✅ Avoid high-risk correction cycles
- ✅ Backtested data from the last 20+ years