
June 09, 2026 a 03:16 pm


Utility Stocks - Performance Analysis
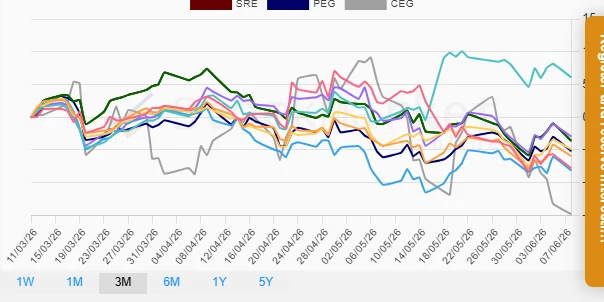
📊 In this performance analysis, we delve into the recent performance of major utility sector stocks across different timeframes, unveiling top performers and laggards. The utilities sector, often viewed as a defensive arena due to its regular demand, has shown variability in stock performances. Let's unravel these dynamics over one week, one month, and three months to better grasp the investment landscape.
Utility Stocks Performance One Week
| Stock | Performance (%) | Performance |
|---|---|---|
| SO | 0.87 | |
| DUK | 0.82 | |
| AEP | -0.24 | |
| EXC | -0.39 | |
| SRE | -0.57 | |
| PEG | -0.71 | |
| D | -1.39 | |
| NEE | -1.92 | |
| CEG | -8.29 |
Utility Stocks Performance One Month
| Stock | Performance (%) | Performance |
|---|---|---|
| D | 6.31 | |
| EXC | 2.20 | |
| PEG | 0.94 | |
| SO | -0.43 | |
| DUK | -1.57 | |
| AEP | -2.40 | |
| SRE | -2.58 | |
| NEE | -9.91 | |
| CEG | -17.93 |
Utility Stocks Performance Three Months
| Stock | Performance (%) | Performance |
|---|---|---|
| D | 6.10 | |
| AEP | -2.93 | |
| SRE | -3.60 | |
| SO | -4.87 | |
| PEG | -5.18 | |
| DUK | -5.95 | |
| NEE | -7.80 | |
| EXC | -8.13 | |
| CEG | -14.82 |
Summary
🧐 Over the short term, the utility sector exhibits significant divergences. The last week's standout stock was Southern Company (SO), enjoying the highest positive movement. Conversely, Constellation Energy Group (CEG) consistently demonstrates the most pronounced depreciation across all examined periods. Dominion Energy (D) remains resilient, particularly over the monthly and quarterly stretches. For investors targeting stability within the utilities sector, a diversified approach encompassing both rising stars and cautious positions is advised to balance the erratic volatilities evident in the current market climate.
Smart Data Insight
Master the Perfect Entry & Exit for this Stock
Don't leave your profits to chance. Historically, this stock follows specific seasonal patterns that institutional traders use to maximize returns.
- ✅ Identify the "Golden Buying Window"
- ✅ Avoid high-risk correction cycles
- ✅ Backtested data from the last 20+ years