
September 08, 2026 a 03:16 pm


Utility Stocks - Performance Analysis
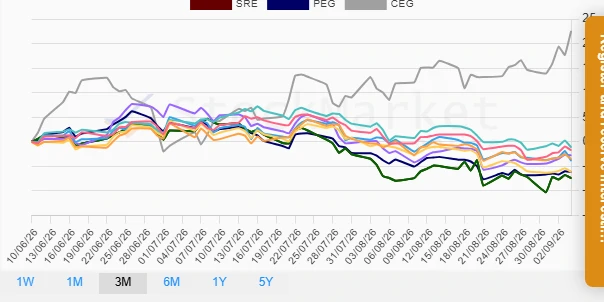
The utilities sector experienced varied performance across recent periods, with significant fluctuations observed over weekly, monthly, and quarterly spans. Notably, these stocks faced mixed market conditions, reflecting underlying economic and operational factors. Investors should consider these dynamics when evaluating their utility sector holdings.
📊 Utility Stocks Performance One Week
| Stock | Performance (%) | Performance |
|---|---|---|
| CEG | 6.63% | |
| AEP | 1.25% | |
| NEE | 0.61% | |
| PEG | 0.30% | |
| SO | 0.03% | |
| DUK | -0.13% | |
| SRE | -0.26% | |
| EXC | -0.41% | |
| D | -0.80% |
📊 Utility Stocks Performance One Month
| Stock | Performance (%) | Performance |
|---|---|---|
| CEG | 10.67% | |
| SRE | 0.52% | |
| AEP | -0.85% | |
| NEE | -1.37% | |
| D | -2.27% | |
| PEG | -2.55% | |
| DUK | -3.64% | |
| EXC | -4.29% | |
| SO | -4.99% |
📊 Utility Stocks Performance Three Months
| Stock | Performance (%) | Performance |
|---|---|---|
| CEG | 22.55% | |
| PEG | -6.15% | |
| SO | -6.16% | |
| AEP | -2.76% | |
| NEE | -1.73% | |
| D | -1.15% | |
| EXC | -3.89% | |
| DUK | -3.52% | |
| SRE | -7.41% |
🔍 Summary
Over the analyzed periods, CEG emerged consistently as the top performer across all time frames, demonstrating resilience amid market volatility. In contrast, SO and SRE consistently underperformed, raising concerns about their current operational challenges or market perceptions. For strategic investors, CEG offers promising momentum, whereas a cautious approach may be advised regarding SO and SRE, pending further market evaluations.
Smart Data Insight
Master the Perfect Entry & Exit for this Stock
Don't leave your profits to chance. Historically, this stock follows specific seasonal patterns that institutional traders use to maximize returns.
- ✅ Identify the "Golden Buying Window"
- ✅ Avoid high-risk correction cycles
- ✅ Backtested data from the last 20+ years