October 07, 2025 a 03:17 pm


Utility Stocks - Performance Analysis
The utilities sector has shown substantial variability in its recent performance across different time horizons. While some stocks have outperformed consistently, others have faced challenges, impacting the overall sector sentiment. Identifying these patterns can help investors make informed decisions and adjust their portfolios accordingly. This analysis will provide a detailed look into the weekly, monthly, and quarterly performances of major utility stocks.
📊 Utility Stocks Performance One Week
| Stock | Performance (%) | Performance |
|---|---|---|
| CEG | 10.35 | |
| NEE | 8.55 | |
| AEP | 2.78 | |
| SRE | 2.76 | |
| EXC | 1.50 | |
| SO | 0.76 | |
| D | 0.54 | |
| DUK | 0.53 | |
| PEG | -1.96 |
📊 Utility Stocks Performance One Month
| Stock | Performance (%) | Performance |
|---|---|---|
| CEG | 19.64 | |
| NEE | 14.94 | |
| SRE | 13.34 | |
| AEP | 6.85 | |
| D | 5.64 | |
| EXC | 5.15 | |
| DUK | 3.14 | |
| SO | 4.01 | |
| PEG | 0.99 |
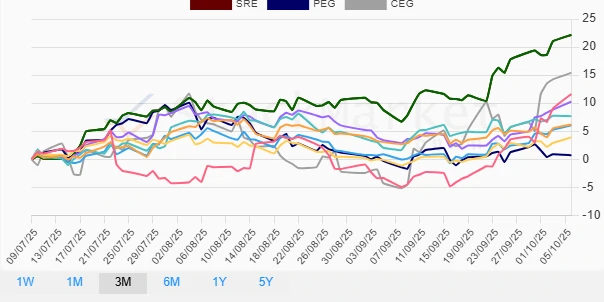
📊 Utility Stocks Performance Three Months
| Stock | Performance (%) | Performance |
|---|---|---|
| SRE | 22.15 | |
| CEG | 15.39 | |
| NEE | 11.61 | |
| AEP | 10.25 | |
| D | 7.69 | |
| DUK | 6.20 | |
| EXC | 6.04 | |
| SO | 3.91 | |
| PEG | 0.71 |
✅ Summary
Overall, the analysis indicates that CEG and SRE have demonstrated robust performance across the various timeframes, whereas PEG struggled notably in comparison. The data suggests a need to carefully evaluate holdings within the utilities sector, especially focusing on stocks with consistent upward momentum, which could be more resilient in volatility. As such, a diversified approach with a focus on emerging trends and top performers may provide the strategic edge needed within this sector.
Smart Data Insight
Master the Perfect Entry & Exit for this Stock
Don't leave your profits to chance. Historically, this stock follows specific seasonal patterns that institutional traders use to maximize returns.
- ✅ Identify the "Golden Buying Window"
- ✅ Avoid high-risk correction cycles
- ✅ Backtested data from the last 20+ years