
July 07, 2026 a 03:16 pm


Utility Stocks - Performance Analysis
📊 The utility sector showed varying performance across different time horizons, reflecting market sentiment, regulatory impacts, and sector-specific dynamics. Short-term variations reveal caution in investment strategies, while medium-term trends indicate a clearer stance on market leadership within the sector.
📈 Utility Stocks Performance One Week
Over the past week, the utility stocks presented a mixed performance picture. The variation among stocks highlights the short-term volatility typical in the sector, driven by both macroeconomic factors and individual company news.
| Stock | Performance (%) | Performance |
|---|---|---|
| D | 1.46% | |
| EXC | 1.00% | |
| SO | 0.36% | |
| SRE | 0.28% | |
| NEE | -0.34% | |
| DUK | -0.39% | |
| PEG | -0.44% | |
| AEP | -0.56% | |
| CEG | -0.85% |
📊 Utility Stocks Performance One Month
The one-month period shows a relatively positive trend across the board for the utility stocks, suggesting improved investor sentiment and potential strategic adjustments within companies to address the broader economic factors.
| Stock | Performance (%) | Performance |
|---|---|---|
| AEP | 5.30% | |
| SO | 3.77% | |
| D | 3.57% | |
| EXC | 2.99% | |
| NEE | 1.97% | |
| SRE | 1.79% | |
| PEG | 1.75% | |
| DUK | 1.59% | |
| CEG | -3.01% |
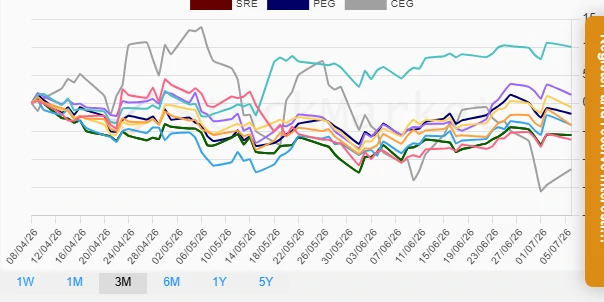
📉 Utility Stocks Performance Three Months
Over the three-month horizon, the utility sector faced significant headwinds, yielding a polarized performance. The period saw notable winners and substantial losers, reflecting strategic shifts and external pressures.
| Stock | Performance (%) | Performance |
|---|---|---|
| D | 10.04% | |
| AEP | 1.51% | |
| SO | -0.74% | |
| PEG | -1.88% | |
| EXC | -3.86% | |
| DUK | -3.90% | |
| SRE | -5.69% | |
| NEE | -6.50% | |
| CEG | -11.78% |
✅ Summary
💡 The utility sector's performance analysis unveils pivotal insights into the stocks' short, medium, and long-term dynamics. While some stocks have shown resilience and adapted to economic currents effectively, others continue to face formidable challenges. Strategically, investors might observe the fundamental underpinnings and macroeconomic indicators to recalibrate their portfolio strategies moving forward, emphasizing stocks with positive forward-looking adjustments and strong management decisions.
Smart Data Insight
Master the Perfect Entry & Exit for this Stock
Don't leave your profits to chance. Historically, this stock follows specific seasonal patterns that institutional traders use to maximize returns.
- ✅ Identify the "Golden Buying Window"
- ✅ Avoid high-risk correction cycles
- ✅ Backtested data from the last 20+ years