
October 06, 2026 a 03:16 pm


Utility Stocks - Performance Analysis
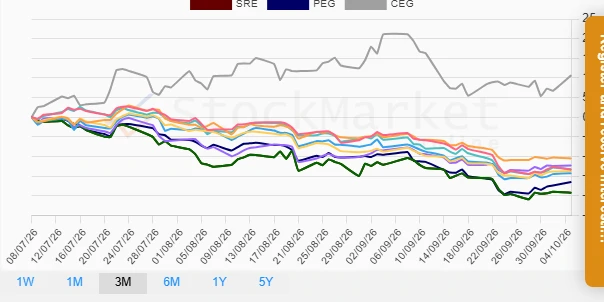
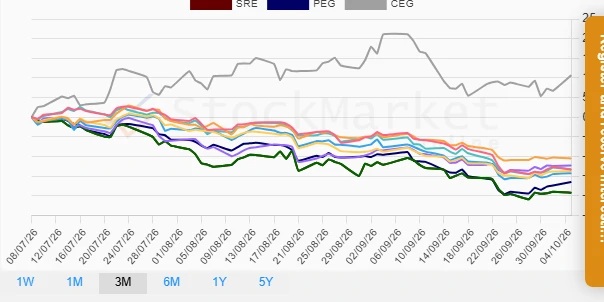
📊 The utilities sector, known for its steady yet unexciting characteristics, is experiencing notable volatility in recent months. Comprehensive analysis of standout performances among major utility stocks reveals crucial trends over the past week, month, and quarter. This detailed insight assists stakeholders in aligning their portfolios with market dynamics.
Utility Stocks Performance One Week
| Stock | Performance (%) | Performance |
|---|---|---|
| PEG | 1.49 | |
| CEG | 1.32 | |
| D | 0.64 | |
| NEE | 0.52 | |
| SO | 0.41 | |
| EXC | 0.41 | |
| AEP | 0.37 | |
| SRE | -0.02 | |
| DUK | -0.33 |
Utility Stocks Performance One Month
| Stock | Performance (%) | Performance |
|---|---|---|
| CEG | -10.45 | |
| NEE | -8.86 | |
| D | -7.50 | |
| SRE | -7.13 | |
| PEG | -6.90 | |
| EXC | -6.61 | |
| DUK | -5.40 | |
| SO | -4.95 | |
| AEP | -3.83 |
Utility Stocks Performance Three Months
| Stock | Performance (%) | Performance |
|---|---|---|
| SRE | -19.24 | |
| PEG | -16.49 | |
| EXC | -14.27 | |
| SO | -13.74 | |
| D | -13.25 | |
| NEE | -13.39 | |
| AEP | -12.30 | |
| DUK | -10.49 | |
| CEG | 10.65 |
Summary
💡 Throughout the analysis period, utility stocks displayed considerable volatility, influenced heavily by macroeconomic factors. While CEG emerged as a distinct outperformer over three months, illustrating resilience against broader declines, SRE exhibited persistent weakness. The measured bearish outlook over one month suggests caution moving forward, highlighting potential strategic shifts for risk-averse investors.
Smart Data Insight
Master the Perfect Entry & Exit for this Stock
Don't leave your profits to chance. Historically, this stock follows specific seasonal patterns that institutional traders use to maximize returns.
- ✅ Identify the "Golden Buying Window"
- ✅ Avoid high-risk correction cycles
- ✅ Backtested data from the last 20+ years