May 05, 2026 a 03:16 pm


Utility Stocks - Performance Analysis
The utility sector displays a varied performance across different time frames, reflecting external economic conditions and internal company strategies. This analysis provides insights into the performance of major utility stocks over the past week, month, and three months. Understanding these performance trends can guide investment decisions and highlight the stability typically associated with utilities.
📊 Utility Stocks Performance One Week
| Stock | Performance (%) | Performance |
|---|---|---|
| CEG | 5.18% | |
| SO | 1.73% | |
| SRE | 1.62% | |
| D | 0.16% | |
| PEG | -0.21% | |
| DUK | -0.23% | |
| AEP | -0.65% | |
| EXC | -0.88% | |
| NEE | -0.92% |
📊 Utility Stocks Performance One Month
| Stock | Performance (%) | Performance |
|---|---|---|
| CEG | 17.22% | |
| NEE | 2.92% | |
| AEP | 1.61% | |
| D | 0.48% | |
| PEG | -1.48% | |
| SO | -1.38% | |
| SRE | -4.83% | |
| DUK | -3.55% | |
| EXC | -5.55% |
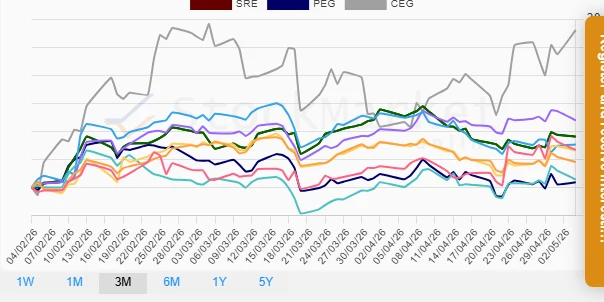
📊 Utility Stocks Performance Three Months
| Stock | Performance (%) | Performance |
|---|---|---|
| CEG | 28.01% | |
| AEP | 11.95% | |
| SRE | 9.05% | |
| EXC | 7.64% | |
| NEE | 6.67% | |
| SO | 6.60% | |
| DUK | 4.52% | |
| D | 1.41% | |
| PEG | 0.90% |
Summary
The utility sector has shown mixed results over varying time frames, influenced by both market dynamics and sector-specific factors. In the short term, CEG has emerged as a consistent leader, particularly noticeable in its one month and three months performance where it secured a significant upside. Conversely, stocks like EXC and SRE underperformed notably in the shorter span of one month. Overall, the three-month period reflected strong rebounds among utility stocks, despite some short-term volatility. Looking forward, these trends suggest careful monitoring of individual stock performance tied with external factors could present advantageous opportunities for long-term investors.
Smart Data Insight
Master the Perfect Entry & Exit for this Stock
Don't leave your profits to chance. Historically, this stock follows specific seasonal patterns that institutional traders use to maximize returns.
- ✅ Identify the "Golden Buying Window"
- ✅ Avoid high-risk correction cycles
- ✅ Backtested data from the last 20+ years