August 05, 2025 a 03:16 pm


Utility Stocks - Performance Analysis
In the past periods, the utility sector has experienced varied movements. From short-term fluctuations to relatively stable trends, we observe differing rates of returns across different stocks. This comprehensive analysis provides insights into the performances over one week, one month, and three months, showcasing top performers and highlighting underlying trends.
Utility Stocks Performance One Week 📊
In the past week, utility stocks have displayed noticeable variations in performance. The top gainer for this period is CEG with a significant rise of 7.31%, demonstrating strength in a volatile market. Conversely, NEE witnessed the most substantial drop of -1.98%. The sector, on the whole, has shown resilience with positive movements in several entities.
| Stock | Performance (%) | Performance |
|---|---|---|
| CEG | 7.31% | |
| AEP | 5.23% | |
| D | 4.18% | |
| DUK | 3.86% | |
| SRE | 2.27% | |
| EXC | 1.97% | |
| PEG | 1.73% | |
| SO | 0.84% | |
| NEE | -1.98% |
Utility Stocks Performance One Month 📈
Over the last month, utility stocks have broadly rallied, displaying strong upward momentum. CEG remains a standout performer with a robust gain of 13.42%. Most stocks in the sector have appreciated, with PEG and AEP also showcasing significant growth, each exceeding 10%. The sector has generally thrived, indicating investor confidence and favorable market conditions.
| Stock | Performance (%) | Performance |
|---|---|---|
| CEG | 13.42% | |
| PEG | 10.59% | |
| AEP | 10.34% | |
| SRE | 10.11% | |
| D | 7.38% | |
| DUK | 5.77% | |
| SO | 4.83% | |
| EXC | 4.74% | |
| NEE | -4.32% |
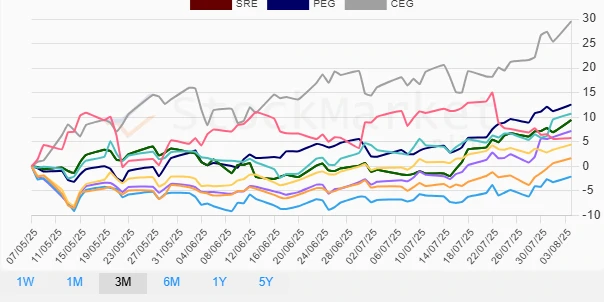
Utility Stocks Performance Three Months 📉
Over a span of three months, utility stocks have generally posted gains, with CEG leading the sector with a staggering increase of 29.53%. This performance underscores a stable growth trajectory within the sector, with most stocks reporting positive returns. However, EXC stands out with a negative return, dropping by -2.11%, which requires careful monitoring for any potential risks or underlying issues.
| Stock | Performance (%) | Performance |
|---|---|---|
| CEG | 29.53% | |
| PEG | 12.55% | |
| D | 10.71% | |
| SRE | 9.40% | |
| AEP | 7.19% | |
| NEE | 5.77% | |
| SO | 4.43% | |
| DUK | 1.64% | |
| EXC | -2.11% |
Summary ✅
Across the analyzed timeframes, utility stocks have largely performed well, with positive returns in most cases. CEG consistently emerged as the top performer, while specific stocks like NEE and EXC exhibited some vulnerabilities in certain periods. Overall, the sector appears stable with strong growth potential, though individual stock performance should be carefully monitored for informed investment decisions.
Smart Data Insight
Master the Perfect Entry & Exit for this Stock
Don't leave your profits to chance. Historically, this stock follows specific seasonal patterns that institutional traders use to maximize returns.
- ✅ Identify the "Golden Buying Window"
- ✅ Avoid high-risk correction cycles
- ✅ Backtested data from the last 20+ years