
August 04, 2026 a 03:16 pm


Utility Stocks - Performance Analysis
The utilities sector has displayed a dynamic performance over various durations with considerable divergences in stock outcomes. The sector's short-term one-week performance displays a mixed bag of results from significant declines to notable gains. Longer-term views tell the story of both resilience and volatility, characteristic of a sector balancing growth factors against external market influences. Recognizing standout performers and laggards provides invaluable insights for future investment strategies.
📊 Utility Stocks Performance One Week
In the one-week observation, Constellation Energy Group (CEG) emerged as the sole positive performer with a substantial gain of 5.31%. The remainder of the sector was mired in negative territory, highlighting a short-term challenge for the utilities stocks. Southern Company (SO) recorded the most pronounced decline. This period encapsulates a minor bullish opportunity amidst overall bearish trends.
| Stock | Performance (%) | Performance |
|---|---|---|
| CEG | 5.31% | |
| D | -2.67% | |
| PEG | -2.98% | |
| NEE | -3.10% | |
| SRE | -3.14% | |
| AEP | -3.55% | |
| EXC | -3.55% | |
| DUK | -3.89% | |
| SO | -4.01% |
📊 Utility Stocks Performance One Month
During the one-month period, Constellation Energy Group (CEG) demonstrated a remarkable surge with a 14.01% increase, contrasting against the sector's overall decline. American Electric Power (AEP) was notably weak, dropping by 7.48%. The results reflect broader market sentiments impacting the utilities space, calling attention to CEG's standout resilience.
| Stock | Performance (%) | Performance |
|---|---|---|
| CEG | 14.01% | |
| D | -1.36% | |
| NEE | -1.97% | |
| DUK | -4.04% | |
| EXC | -4.57% | |
| PEG | -6.22% | |
| SRE | -5.75% | |
| SO | -5.15% | |
| AEP | -7.48% |
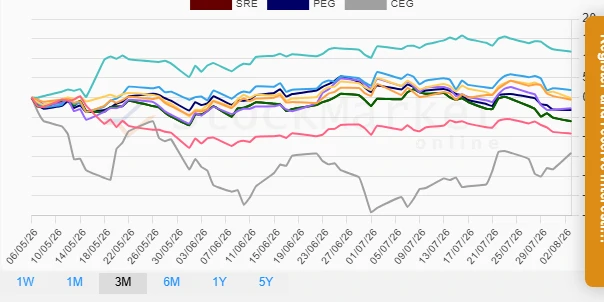
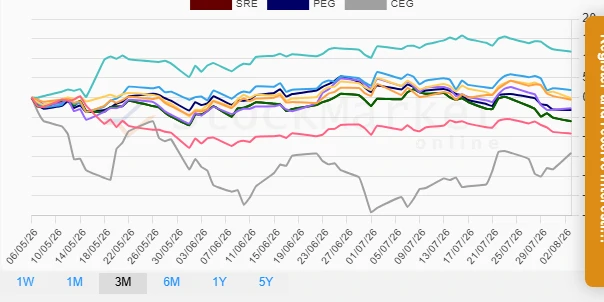
📊 Utility Stocks Performance Three Months
Over a three-month period, Dominion Energy (D) recorded a distinguished growth of 11.68%, outperforming the sector by a sizeable margin. Constellation Energy Group (CEG) faced the steepest decline of 14.09%. Such movements reflect pivotal shifts in market expectations and potential long-term value realization.
| Stock | Performance (%) | Performance |
|---|---|---|
| D | 11.68% | |
| EXC | 1.95% | |
| DUK | -0.56% | |
| SO | -0.18% | |
| PEG | -3.14% | |
| AEP | -2.72% | |
| SRE | -6.05% | |
| NEE | -9.17% | |
| CEG | -14.09% |
🔍 Summary
The utilities sector has demonstrated varying degrees of volatility across different timeframes. Notably, Dominion Energy (D) and Constellation Energy Group (CEG) reflected contrasting performances in the 3-month outlook, indicative of underlying market dynamics and individual corporate strategies. CEG's strong one-month gain suggests short-term investor confidence which has yet to be mirrored in the longer-term assessment. Investors should consider these fluctuations as signals of both volatility and opportunity, warranting caution alongside strategic investment planning.
Smart Data Insight
Master the Perfect Entry & Exit for this Stock
Don't leave your profits to chance. Historically, this stock follows specific seasonal patterns that institutional traders use to maximize returns.
- ✅ Identify the "Golden Buying Window"
- ✅ Avoid high-risk correction cycles
- ✅ Backtested data from the last 20+ years