February 03, 2026 a 03:16 pm


Utility Stocks - Performance Analysis
The utility sector has experienced significant fluctuations in recent months, with varying performance among major stocks. This analysis delves into the performance metrics over the past week, month, and three months. We categorize top performers and underperformers to identify prevailing trends, providing valuable insights to investors.
📊 Utility Stocks Performance One Week
| Stock | Performance (%) | Performance |
|---|---|---|
| PEG | -0.09 | |
| DUK | -0.65 | |
| SO | -0.71 | |
| AEP | -0.91 | |
| NEE | -0.93 | |
| SRE | -1.02 | |
| D | -1.80 | |
| EXC | -2.05 | |
| CEG | -6.30 |
📊 Utility Stocks Performance One Month
| Stock | Performance (%) | Performance |
|---|---|---|
| NEE | 6.61 | |
| AEP | 2.26 | |
| DUK | 1.80 | |
| D | 1.45 | |
| SO | 1.22 | |
| EXC | 0.07 | |
| PEG | -0.72 | |
| SRE | -3.74 | |
| CEG | -28.88 |
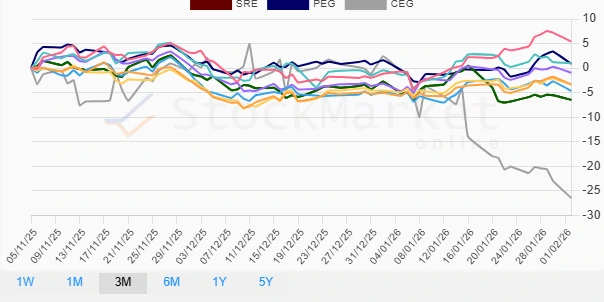
📊 Utility Stocks Performance Three Months
| Stock | Performance (%) | Performance |
|---|---|---|
| NEE | 5.44 | |
| D | 1.00 | |
| PEG | 0.89 | |
| AEP | -0.93 | |
| DUK | -3.29 | |
| SO | -3.35 | |
| EXC | -4.64 | |
| SRE | -6.46 | |
| CEG | -26.45 |
✅ Summary
Over the examined periods, utility sector stocks exhibited diverse performance dynamics. CEG emerged as the most significant underperformer across all timelines, driven by sharp declines, particularly in the one-month and three-month frames. Conversely, NEE has consistently shown resilience, marking the highest gains in the one-month and three-month periods. Investors should consider these trends in the broader context of the utility sector's stability and growth potential, especially when strategizing portfolio diversifications. Active monitoring of individual stock dynamics and sector developments remains essential for optimizing investment outcomes.
Smart Data Insight
Master the Perfect Entry & Exit for this Stock
Don't leave your profits to chance. Historically, this stock follows specific seasonal patterns that institutional traders use to maximize returns.
- ✅ Identify the "Golden Buying Window"
- ✅ Avoid high-risk correction cycles
- ✅ Backtested data from the last 20+ years