September 02, 2025 a 03:16 pm


Utility Stocks - Performance Analysis
In the constantly evolving energy sector, utility stocks have exhibited varied performance over the short to medium-term periods analyzed. This analysis provides an insight into the performance of key utility stocks over one week, one month, and three months, identifying top performers and underperformers while delivering an insight into prevailing market trends.
Utility Stocks Performance One Week
📊 Over the past week, the utility sector saw diverse movements with some stocks moderately improving, while others faced minor setbacks. Despite volatile market conditions, Sempra Energy (SRE) was the top performer with a 0.97% gain, signaling investor confidence in its operational strategy. In contrast, NextEra Energy (NEE) experienced a notable decline of -3.77%, marking it the greatest laggard for this period.
| Stock | Performance (%) | Performance |
|---|---|---|
| SRE | 0.97 | |
| D | 0.14 | |
| DUK | -0.64 | |
| SO | -0.84 | |
| PEG | -1.36 | |
| AEP | -1.43 | |
| EXC | -1.67 | |
| CEG | -2.68 | |
| NEE | -3.77 |
Utility Stocks Performance One Month
📈 Looking at the one-month horizon, a mixed performance is evident. However, NextEra Energy (NEE) with a 2.52% increase and Sempra Energy (SRE) with 2.11% gains stood out positively in stark contrast to Constellation Energy (CEG) and Public Service Enterprise (PEG), which saw a significant decrease of -9.76% and -7.58% respectively, reflecting underlying operational challenges or market reactions.
| Stock | Performance (%) | Performance |
|---|---|---|
| NEE | 2.52 | |
| SRE | 2.11 | |
| DUK | -0.25 | |
| D | -0.74 | |
| EXC | -2.13 | |
| AEP | -2.20 | |
| SO | -2.81 | |
| PEG | -7.58 | |
| CEG | -9.76 |
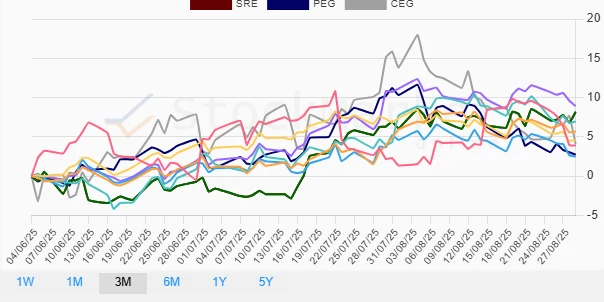
Utility Stocks Performance Three Months
📉 Over the three-month period, a recovery is apparent as many stocks exhibit positive movement. American Electric Power (AEP) leads with an 8.92% gain, reflecting robust performance and investor optimism. Dominion Energy (D) and Sempra Energy (SRE) also posted strong figures at 6.94% and 8.17% respectively, contributing to a positive outlook for the sector.
| Stock | Performance (%) | Performance |
|---|---|---|
| AEP | 8.92 | |
| SRE | 8.17 | |
| D | 6.94 | |
| DUK | 5.68 | |
| SO | 4.57 | |
| CEG | 4.07 | |
| NEE | 3.88 | |
| PEG | 2.73 | |
| EXC | 2.48 |
Summary
🗣️ In summary, utility stocks exhibited a varied performance across different time frames. Over the three-month period, a positive trend emerged with substantial gains from key players like American Electric Power and Sempra Energy. Shorter periods reflect more volatility with various stocks underperforming due to sector-specific challenges or broader market trends. Overall, this analysis suggests a cautiously optimistic outlook, with certain stocks showing resilience and growth potential. Investors should remain vigilant and consider individual stock factors along with macroeconomic trends.
Smart Data Insight
Master the Perfect Entry & Exit for this Stock
Don't leave your profits to chance. Historically, this stock follows specific seasonal patterns that institutional traders use to maximize returns.
- ✅ Identify the "Golden Buying Window"
- ✅ Avoid high-risk correction cycles
- ✅ Backtested data from the last 20+ years