
October 30, 2026 a 04:28 am
USDJPY: Trend and Support & Resistance Analysis
The USDJPY pair has demonstrated fluctuating movements with both upward and downward trends in recent months. Recent short-term data indicates a potential shift. It's crucial for traders to pay close attention to this pair's behavior due to critical support and resistance zones that may influence market direction and trading opportunities.
Trend Analysis
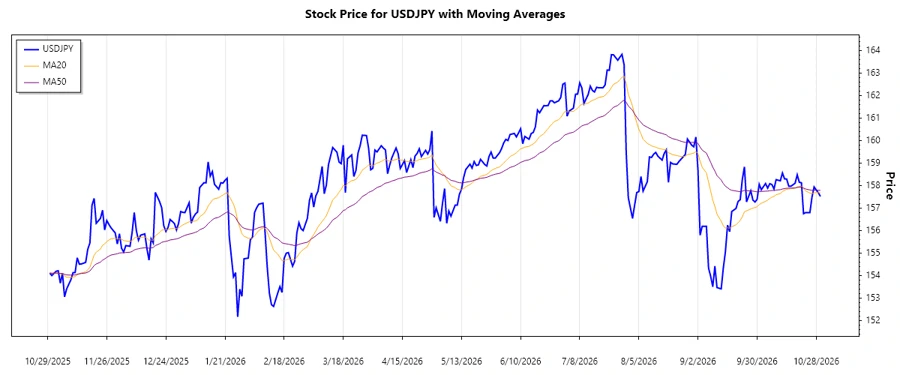
The USDJPY shows a series of moderate trends over the past few weeks. Utilizing the exponential moving averages (EMA), traders can see technical indicators providing insight into the current trend stance:
| Date | Close Price | Trend |
|---|---|---|
| 2026-10-30 | 157.523 | ▼ |
| 2026-10-29 | 157.69 | ▲ |
| 2026-10-28 | 157.81 | ▲ |
| 2026-10-27 | 157.948 | ▲ |
| 2026-10-26 | 157.499 | ▼ |
| 2026-10-25 | 156.803 | ▼ |
| 2026-10-23 | 156.806 | ▼ |
EMA calculations reveal a short-term ▼ downtrend, which may signify bearish pressure. Continuous monitoring of crossovers between EMA20 and EMA50 is recommended.
Support and Resistance
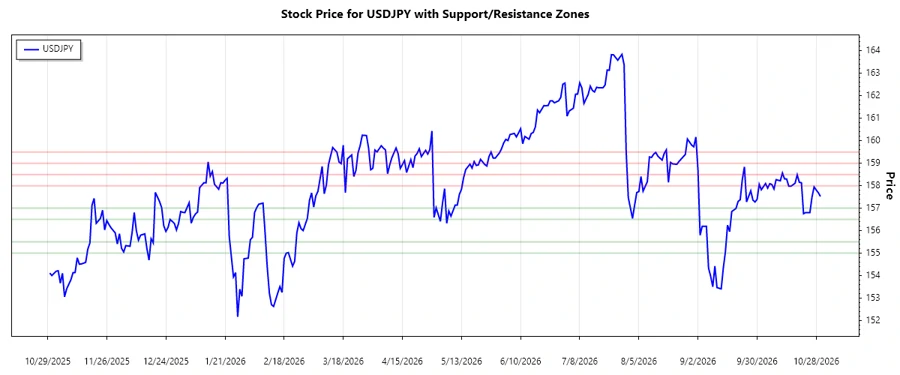
Analyzing the closing prices of USDJPY reveals the following potential zones of support and resistance, which could serve as significant barriers to movement:
| Type | From | To |
|---|---|---|
| Support | 155.00 | 155.50 |
| Support | 156.50 | 157.00 |
| Resistance | 158.00 | 158.50 |
| Resistance | 159.00 | 159.50 |
Currently, the price hovers within a critical support range between 156.50-157.00, suggesting potential buying pressure.
Conclusion
The USDJPY currency pair is delicately positioned at a critical technical point. As it stands near the support zone, traders should remain cautious. While recent trends suggest bearish sentiments, potential recovery could shift dynamics if current levels hold. It's vital to track any breach of support or resistance levels as they will provide further confirmation of the forthcoming directional move. Market participants should be wary of volatility and adjust their strategies accordingly, staying abreast of economic releases that could impact USDJPY fluctuations.
Smart Data Insight
Master the Perfect Entry & Exit for this Stock
Don't leave your profits to chance. Historically, this stock follows specific seasonal patterns that institutional traders use to maximize returns.
- ✅ Identify the "Golden Buying Window"
- ✅ Avoid high-risk correction cycles
- ✅ Backtested data from the last 20+ years