
October 21, 2026 a 04:28 am
USDJPY: Trend and Support & Resistance Analysis
The USDJPY exchange rate has demonstrated varied performance over the recent months. Fluctuations have been noted with potential shifts in market sentiment. Identifying the current trend and key support and resistance levels is crucial for strategic financial decisions. A detailed analysis highlights the prevailing market dynamics that could influence future exchange rate movements.
Trend Analysis
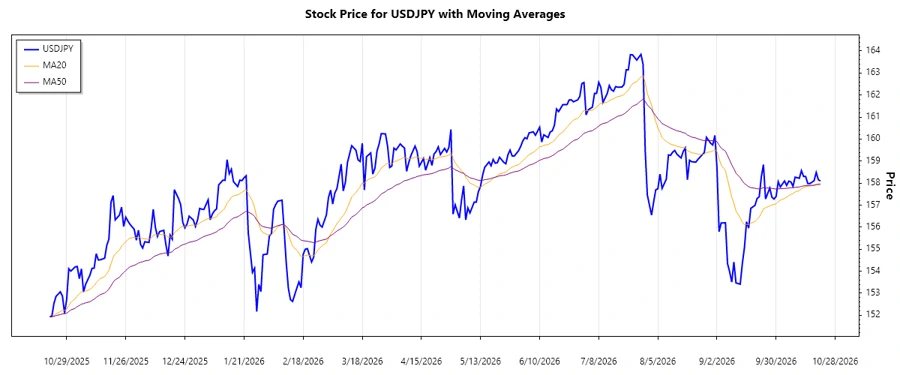
The analysis based on the provided data indicates that the USDJPY is currently in a mixed zone with recent momentum balancing between fluctuations. Calculating the EMA20 and EMA50 provides insights into current movements:
| Date | Closing Price | Trend |
|---|---|---|
| 2026-10-21 | 158.098 | ▲ Uptrend |
| 2026-10-20 | 158.153 | ▲ Uptrend |
| 2026-10-19 | 158.486 | ▲ Uptrend |
| 2026-10-18 | 158.112 | ▼ Downtrend |
| 2026-10-16 | 157.976 | ▼ Downtrend |
| 2026-10-15 | 157.977 | ▼ Downtrend |
| 2026-10-14 | 158.299 | ▲ Uptrend |
The short-term trend suggests a minor upward momentum; however, close attention should be paid to potential reversals. Such trend patterns typically indicate opportunities for traders forecasting potential volatility.
Support and Resistance
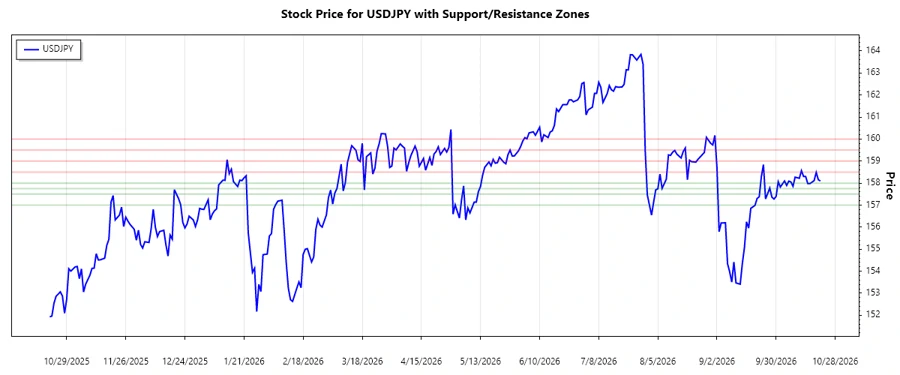
Identifying key support and resistance levels is essential for market strategy formation. The data shows the following significant zones:
| Zone Type | Price Range |
|---|---|
| Support Zone 1 | 157.00 - 157.50 |
| Support Zone 2 | 157.75 - 158.00 |
| Resistance Zone 1 | 158.50 - 159.00 |
| Resistance Zone 2 | 159.50 - 160.00 |
The USDJPY currently meets resistance indicators, suggesting a potential pause or reversal in upward movement. These zones are pivotal in determining entry and exit points in currency trades.
Conclusion
Analyzing the USDJPY market indicates a critical phase for investors and traders. The identified trends and support/resistance levels provide a framework for informed decision-making. Traders should remain vigilant for sudden market shifts that could alter the established dynamics. This period offers both risks and opportunities depending on market responses to external factors.
Smart Data Insight
Master the Perfect Entry & Exit for this Stock
Don't leave your profits to chance. Historically, this stock follows specific seasonal patterns that institutional traders use to maximize returns.
- ✅ Identify the "Golden Buying Window"
- ✅ Avoid high-risk correction cycles
- ✅ Backtested data from the last 20+ years