
October 11, 2026 a 04:28 amUSDJPY: Trend and Support & Resistance Analysis
USDJPY: Trend and Support & Resistance Analysis
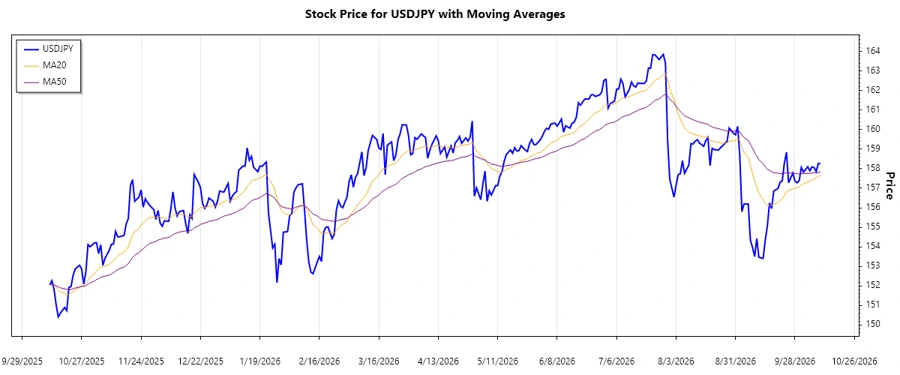
The USDJPY pair has been demonstrating significant trends over the past months. Our analysis is focusing on the recent data to evaluate the ongoing trends and identify key support and resistance zones. Technical indicators such as EMA20 and EMA50 are utilized to provide a clearer picture of the pair's performance and forecast potential directions.
Trend Analysis
Analyzing the USDJPY currency pair, it is evident that over the past months, trends have shifted dynamically, influenced by both economic data and geopolitical events. Calculating the EMA20 and EMA50 provides insight into the current trend direction. We observe that when EMA20 crosses over EMA50, it generally signifies an upward momentum, whereas a cross under indicates a downward trend.
| Date | Close Price | Trend |
|---|---|---|
| 2026-10-10 | 158.246 | ▲ Now in an upward trend |
| 2026-10-09 | 158.270 | ▲ Continuing upward trend |
| 2026-10-08 | 157.856 | ▲ Upward movement |
| 2026-10-07 | 158.054 | ▲ Moving up |
| 2026-10-06 | 158.091 | ▲ Upward trend |
| 2026-10-05 | 157.894 | ▲ Rising trend |
| 2026-10-04 | 158.098 | ▲ Slight upward trend |
The current analysis suggests a bullish sentiment, reinforced by the consistent crossing of EMA20 over EMA50. This aligns with the historical upward momentum seen in recent weeks.
Support and Resistance
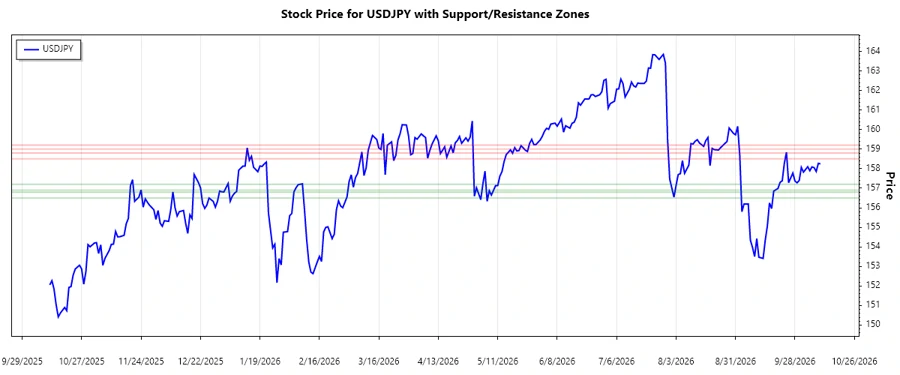
In terms of support and resistance, recent price action levels have been identified as potential zones where the currency pair may experience a change in trend or continue its current trajectory. These are critical for traders to monitor.
| Zone Type | From Price | To Price |
|---|---|---|
| Support 1 | 156.50 | 156.80 |
| Support 2 | 156.90 | 157.20 |
| Resistance 1 | 158.50 | 158.80 |
| Resistance 2 | 159.00 | 159.20 |
The current price movement suggests that USDJPY is oscillating near a resistance zone. Traders should be cautious of potential reversals or breakouts in these areas.
Conclusion
The USDJPY has shown a notable bullish trajectory over recent weeks, with EMA indicators supporting the upward trend analysis. However, as it approaches known resistance zones, caution is advised due to potential volatility. Traders need to keep an eye on both fundamental and technical indicators that can influence the currency’s direction. Such trends emphasize the importance of strategic entry and exit points to capitalize on potential movements while managing risks effectively.
Smart Data Insight
Master the Perfect Entry & Exit for this Stock
Don't leave your profits to chance. Historically, this stock follows specific seasonal patterns that institutional traders use to maximize returns.
- ✅ Identify the "Golden Buying Window"
- ✅ Avoid high-risk correction cycles
- ✅ Backtested data from the last 20+ years