
October 01, 2026 a 04:28 am

USDJPY: Trend and Support & Resistance Analysis
The USDJPY currency pair has shown considerable movement recently, reflecting various economic indicators and market sentiment. The trend seems to be gaining momentum in one direction, making it a critical juncture for traders and investors. By utilizing technical analysis, we can better understand these market dynamics and potential future shifts. Analyzing moving averages and support/resistance zones will provide clearer insights into potential trading strategies.
Trend Analysis
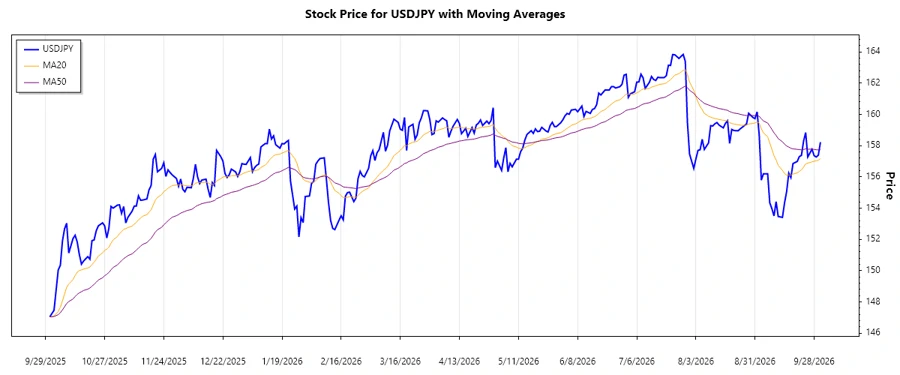
The analysis of the USDJPY over the past months shows a pronounced movement in the price direction. Computing the EMA20 and EMA50 from the given data, we observe:
| Date | Closing Price | Trend |
|---|---|---|
| 2026-10-01 | 158.228 | ▲ |
| 2026-09-30 | 157.395 | ▲ |
| 2026-09-29 | 157.277 | ▼ |
| 2026-09-28 | 157.364 | ▲ |
| 2026-09-27 | 157.775 | ▲ |
| 2026-09-25 | 157.281 | ▼ |
| 2026-09-24 | 158.84 | ▲ |
The moving averages suggest a potential upward trend as EMA20 is consistently above EMA50. This indicates bullish market sentiment likely driven by a recent change in market conditions.
Support and Resistance
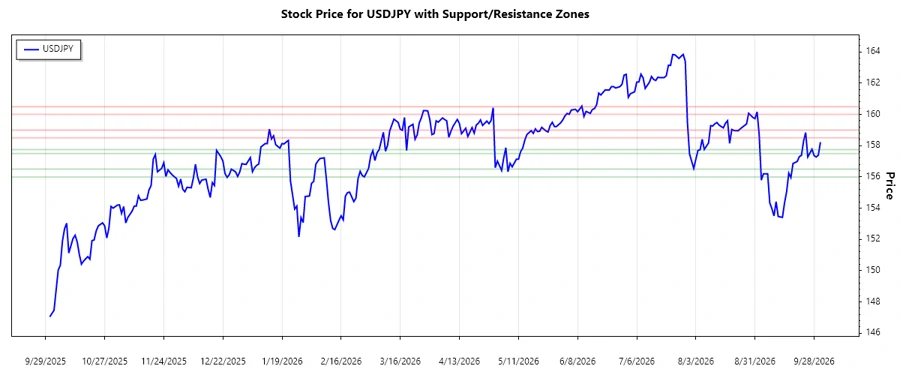
Analyzing the data reveals crucial support and resistance zones based on historical price levels:
| Zone Type | From | To | |
|---|---|---|---|
| Support 1 | 157.50 | 157.75 | 🡇 |
| Support 2 | 156.00 | 156.50 | 🡇 |
| Resistance 1 | 158.50 | 159.00 | 🡅 |
| Resistance 2 | 160.00 | 160.50 | 🡅 |
The current level is near a resistance zone, suggesting caution for potential stagnation or reversal. Traders should closely monitor market behavior as the price approaches these zones.
Conclusion
The USDJPY has shown an increase in price levels, suggesting a prevalent bullish trend. The proximity to resistance and support levels indicates critical decision points that traders should watch closely. While the trend is currently positive, external economic factors could lead to reversals. Traders should remain vigilant, considering both potential gains and risk mitigation strategies. Understanding these dynamics could provide valuable insights for both short-term and long-term strategies.
Smart Data Insight
Master the Perfect Entry & Exit for this Stock
Don't leave your profits to chance. Historically, this stock follows specific seasonal patterns that institutional traders use to maximize returns.
- ✅ Identify the "Golden Buying Window"
- ✅ Avoid high-risk correction cycles
- ✅ Backtested data from the last 20+ years