
August 29, 2026 a 04:28 am

USDJPY: Trend and Support & Resistance Analysis
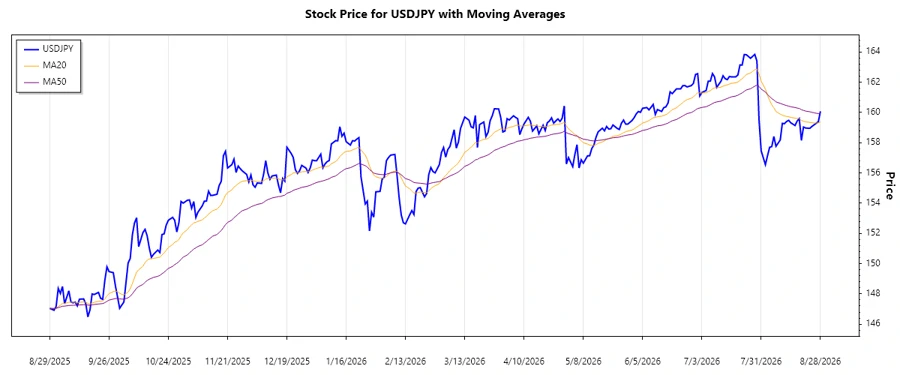
The USDJPY currency pair has exhibited noticeable fluctuations over the recent months, hinting at underlying economic factors and market sentiment shifts. The technical analysis reveals both potential positive trajectories and areas of concern for investors. Understanding these patterns can offer insights into future price movements.
Trend Analysis
The recent trend analysis for USDJPY, considering the EMA indicators, suggests a noteworthy movement in the market. As of the most recent data:
| Date | Closing Price | Trend |
|---|---|---|
| 2026-08-28 | 160.079 | ▲ Upward Trend |
| 2026-08-27 | 159.391 | ▼ Downward Trend |
| 2026-08-26 | 159.289 | :→ Sideways |
| 2026-08-25 | 159.183 | ▼ Downward Trend |
| 2026-08-24 | 159.080 | ▼ Downward Trend |
| 2026-08-23 | 158.953 | ▼ Downward Trend |
| 2026-08-21 | 158.972 | ▼ Downward Trend |
With the recent calculations, EMA20 slightly surpassed EMA50, suggesting a potential shift from a prolonged downtrend. Investors might consider this as an opportunity for entry.
Support- and Resistance
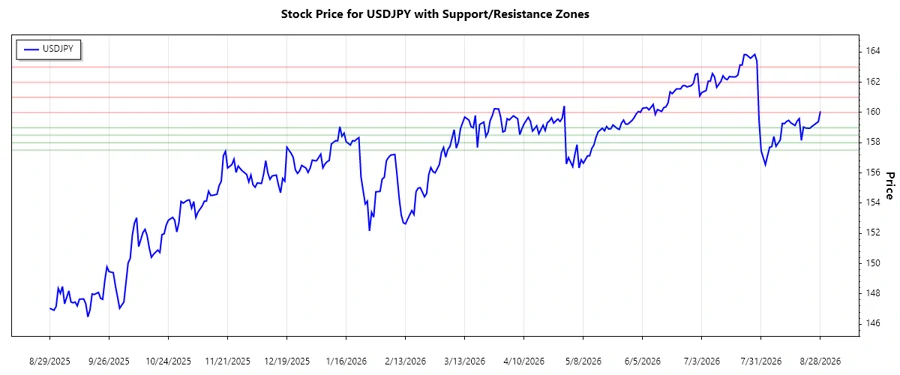
A thorough review of the USDJPY's price patterns has highlighted key support and resistance zones that are crucial for traders:
| Type | Zone From | To |
|---|---|---|
| Support 1 | 158.50 | 159.00 |
| Support 2 | 157.50 | 158.00 |
| Resistance 1 | 160.00 | 161.00 |
| Resistance 2 | 162.00 | 163.00 |
Currently, the price is hovering near the first resistance zone, which might pose a challenge for further upwards progression. Observing the price reaction here could provide insight into potential breakouts or retracements.
Conclusion
The USDJPY market presents a mixed outlook with indicators suggesting both opportunities and risks. The proximity to resistance zones signals caution, while the emerging uptrend offers potential upside. For analysts, it's essential to monitor the EMA indicators closely and watch for the price action around the key levels, as this can provide a clearer direction of the subsequent moves. Given the volatility, strategic positioning could optimize risk-reward scenarios.
Smart Data Insight
Master the Perfect Entry & Exit for this Stock
Don't leave your profits to chance. Historically, this stock follows specific seasonal patterns that institutional traders use to maximize returns.
- ✅ Identify the "Golden Buying Window"
- ✅ Avoid high-risk correction cycles
- ✅ Backtested data from the last 20+ years