
June 02, 2026 a 04:28 am
USDJPY: Trend and Support & Resistance Analysis
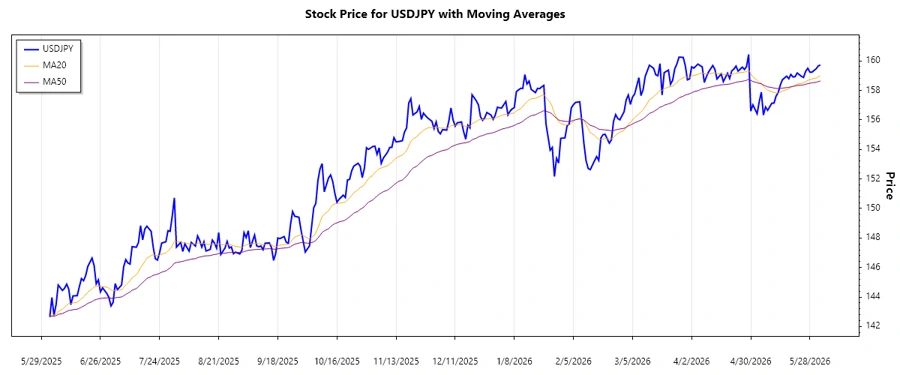
The USDJPY currency pair has demonstrated notable movements, with an evident uptrend in recent months. The calculated EMAs indicate that a bullish momentum has solidified, guided by strong support levels. Investors should be cautious of resistance levels, which could present challenges for further upward movement.
Trend Analysis
Analyzing the recent price history of USDJPY, we observe a consistent upward trajectory. By calculating the 20-day and 50-day EMAs, we can confirm this momentum. The EMA20 currently surpasses the EMA50, indicating a dominant ▲ uptrend. This suggests a robust bullish sentiment among market participants.
| Date | Close Price | Trend |
|---|---|---|
| 2026-06-02 | 159.717 | ▲ |
| 2026-06-01 | 159.658 | ▲ |
| 2026-05-31 | 159.468 | ▲ |
| 2026-05-29 | 159.230 | ▲ |
| 2026-05-28 | 159.230 | ▲ |
| 2026-05-27 | 159.498 | ▲ |
| 2026-05-26 | 159.291 | ▲ |
The consistent upward movement is indicative of bullish market conditions, signaling potential for continued appreciation.
Support and Resistance
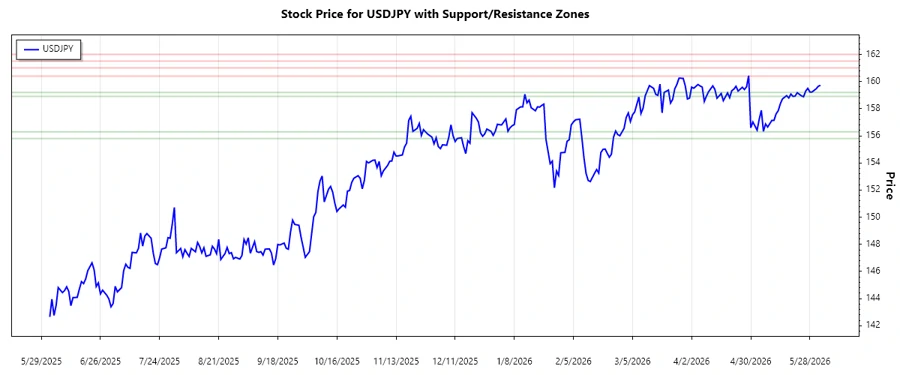
Reviewing the USDJPY price action, two critical support and resistance zones are evident. These levels suggest where the price might encounter buying or selling pressure, thus defining its trajectory.
| Zone Type | From | To |
|---|---|---|
| Support | 155.80 | 156.30 |
| Support | 158.90 | 159.20 |
| Resistance | 160.40 | 161.00 |
| Resistance | 161.50 | 162.00 |
The present prices are influenced by a strong support zone, suggesting a stable base for growth. Caution is advised as the pair approaches closer resistance zones, which might limit upward potential.
Conclusion
In summary, the USDJPY is exhibiting a strong ▲ uptrend supported by significant technical indicators. While the pair enjoys a bullish phase, it is essential to stay mindful of looming resistance levels that may impede upward momentum. Potential for further gains exists if these levels are breached, yet caution remains essential to mitigate risks as these breaches could not materialize. Analysts should keep a vigilant eye on market signals to better navigate the currency pair's movements.
Smart Data Insight
Master the Perfect Entry & Exit for this Stock
Don't leave your profits to chance. Historically, this stock follows specific seasonal patterns that institutional traders use to maximize returns.
- ✅ Identify the "Golden Buying Window"
- ✅ Avoid high-risk correction cycles
- ✅ Backtested data from the last 20+ years