December 01, 2025 a 04:28 am
USDJPY: Trend and Support & Resistance Analysis
The USDJPY has demonstrated a resilient upward trend over the recent months, breaking through key technical levels. With potential upside momentum still in play, traders should remain vigilant of support zones that might provide stability. Resistance levels are poised to challenge the bulls, demanding careful observation.
Trend Analysis
The following analysis exhibits the trend dynamics for the USDJPY over the recent trading sessions:
| Date | Close Price | Trend |
|---|---|---|
| 2025-12-01 | 155.463 | ▲ Upward |
| 2025-11-30 | 155.586 | ▲ Upward |
| 2025-11-28 | 156.128 | ▲ Upward |
| 2025-11-27 | 156.278 | ▲ Upward |
| 2025-11-26 | 156.454 | ▲ Upward |
| 2025-11-25 | 156.031 | ▲ Upward |
| 2025-11-24 | 156.911 | ▲ Upward |
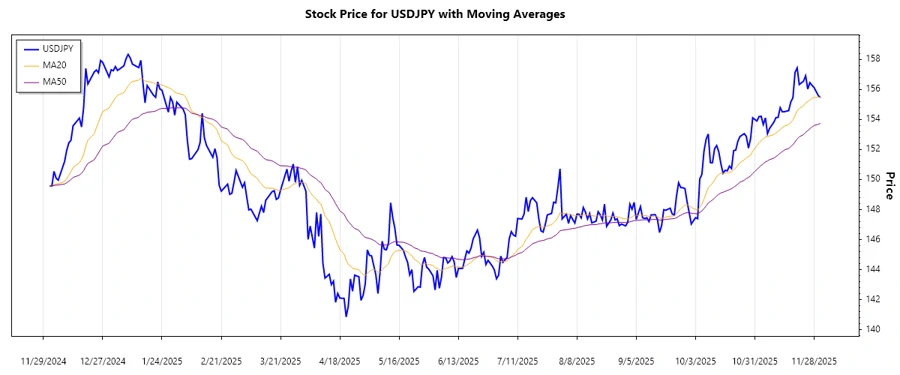
The USDJPY has been in a pronounced upward trend, supported by the 20-day EMA moving above the 50-day EMA. This convergence suggests strong bullish momentum, prompting ongoing market interest.
Support- and Resistance
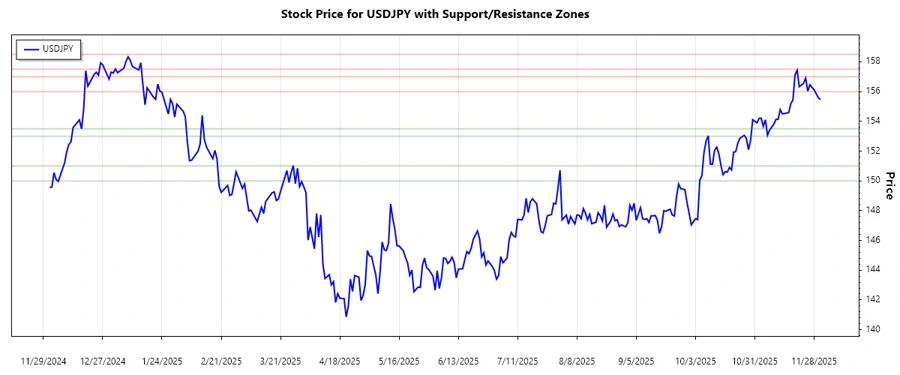
Analyzed below are the crucial support and resistance zones for the USDJPY:
| Zone Type | From | To |
|---|---|---|
| Support 1 | 153.000 | 153.500 |
| Support 2 | 150.000 | 151.000 |
| Resistance 1 | 156.000 | 157.000 |
| Resistance 2 | 157.500 | 158.500 |
Currently, the USDJPY is approaching the resistance zone between 156.000 and 157.000, highlighting potential challenges for further bullish advances. Observing this region is crucial to anticipate possible market reactions.
Conclusion
The recent analysis of USDJPY underscores a solid upward trend sustained by bullish technical indicators. However, resistance levels present potential hurdles that may temper the rally if surpassed. For traders, these junctures offer a strategic opportunity to gauge market sentiment and adjust positions accordingly. Key risks include sharp reversals at resistance points, necessitating preparedness for swift market shifts. Nonetheless, the upward path remains validated by robust technical support.