October 15, 2025 a 04:28 am

USDJPY: Trend and Support & Resistance Analysis
The USDJPY currency pair has shown significant fluctuations over the last few months, reflecting broader economic trends and uncertainties. Traders should be aware of the noted support and resistance levels, which could indicate potential entry or exit points based on price action. Analyzing the EMA trends can offer insights into the ongoing market sentiment, which currently shows varying degrees of strength in the prevailing direction.
Trend Analysis
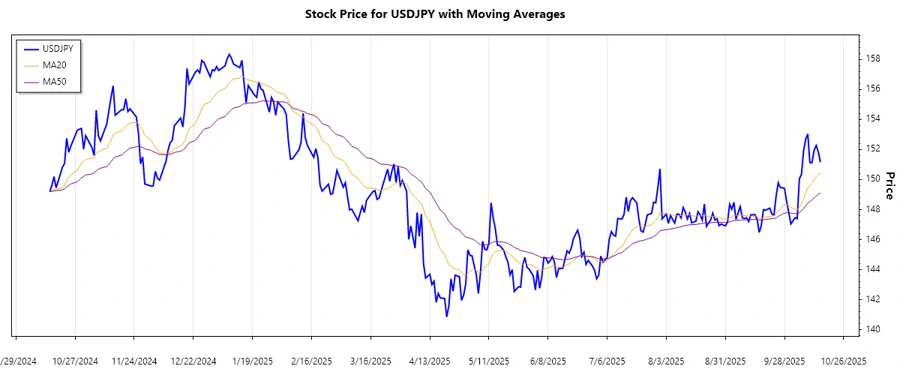
The recent price data for the USDJPY pair suggests fluctuating movements, with signs of a potential emerging trend. By analyzing the 20-day (EMA20) and 50-day (EMA50) exponential moving averages derived from the closing prices, we can infer the market trend. If the EMA20 is above the EMA50, it indicates an upward trend, whereas the reverse suggests a downward momentum. Below is a summary of the trend for the last 7 days.
| Date | Closing Price | Trend |
|---|---|---|
| 2025-10-15 | 151.157 | ▲ Upward |
| 2025-10-14 | 151.837 | ▲ Upward |
| 2025-10-13 | 152.268 | ▼ Downward |
| 2025-10-12 | 151.957 | ▲ Upward |
| 2025-10-11 | 151.119 | ▲ Upward |
| 2025-10-10 | 151.128 | ▼ Downward |
| 2025-10-09 | 153.035 | ▲ Upward |
The above analysis illustrates that the USDJPY is mostly trending upwards with intermittent downward pressure. The EMA calculations will confirm whether the overall momentum remains bullish or if there is a growing bearish sentiment.
Support and Resistance
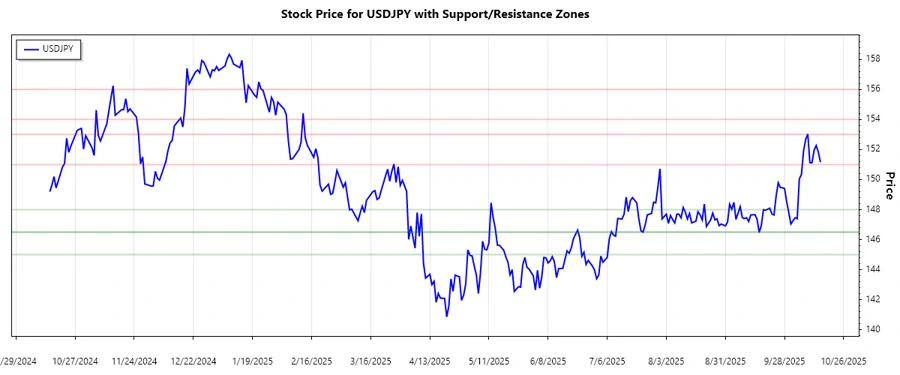
Based on the closing prices, key support and resistance zones were identified for USDJPY. Support levels where price may bounce upward and resistance levels where price may reverse downward are crucial for traders. Below is a table detailing these zones.
| Zone | Level 1 | Level 2 |
|---|---|---|
| Support | 148.000 | 146.500 |
| Resistance | 151.000 | 153.000 |
Currently, the USDJPY trades near the resistance levels, suggesting potential selling pressure unless there is strong bullish momentum. Thus, traders should be vigilant of price action near these critical zones.
Conclusion
The USDJPY analysis underscores a period of caution with both opportunities and risks. While recent movements show an overall upward trend, traders must consider imminent resistance levels. The interplay between technical levels and broader economic factors could dictate future price direction. Understanding the positioning relative to the support and resistance levels is crucial for making informed decisions, especially amid prevailing market uncertainties.
This HTML snippet displays a comprehensive analysis of the USDJPY currency pair's recent trends, support, and resistance levels. The tables and images are tailored for a mobile-friendly experience, and the JSON object at the end provides a structured format for further programmatic use.
Smart Data Insight
Master the Perfect Entry & Exit for this Stock
Don't leave your profits to chance. Historically, this stock follows specific seasonal patterns that institutional traders use to maximize returns.
- ✅ Identify the "Golden Buying Window"
- ✅ Avoid high-risk correction cycles
- ✅ Backtested data from the last 20+ years