August 13, 2025 a 04:28 am
USDJPY: Trend and Support & Resistance Analysis
Analyzing the recent data for USDJPY, there appears to be a steady and gradual movement in the currency pair. While short-term fluctuations have been observed, the broader trend provides insights into potential investment opportunities. The interplay between support and resistance levels further aids in understanding possible market movements.
Trend Analysis
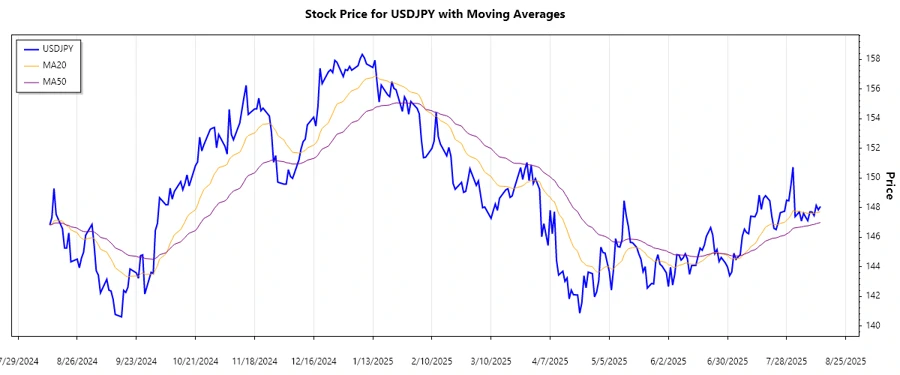
The trend identified from the data indicates a predominance of consolidation with intermittent bullish and bearish phases. Calculating the EMA20 and EMA50 reveals:
| Date | Closing Price | Trend |
|---|---|---|
| 2025-08-13 | 148.066 | ⚖️ |
| 2025-08-12 | 147.836 | ▼ |
| 2025-08-11 | 148.141 | ▲ |
| 2025-08-10 | 147.450 | ▼ |
| 2025-08-09 | 147.692 | ▲ |
| 2025-08-08 | 147.703 | ▲ |
| 2025-08-07 | 147.106 | ▼ |
The current analysis suggests a neutral to slightly bullish environment, especially since the EMA20 is relatively close to the EMA50, indicating potential sideways movement.
Support and Resistance
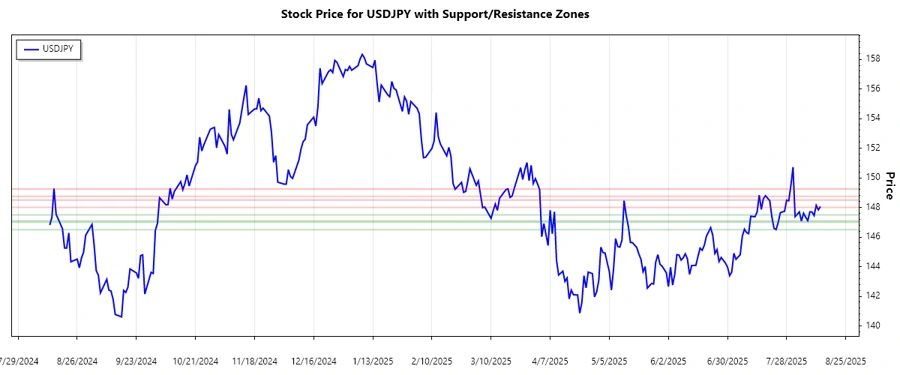
Reviewing the data closely, the support and resistance zones have been identified:
| Zone | Range |
|---|---|
| Support 1 | 147.10 to 147.50 |
| Support 2 | 146.50 to 147.00 |
| Resistance 1 | 148.00 to 148.50 |
| Resistance 2 | 148.75 to 149.25 |
Currently, the price is hovering near a support level, suggesting a possible rebound. The technical interpretation would focus on the breakout from these zones to capture any significant shifts in momentum.
Conclusion
The analysis of USDJPY shows a mixed trend with no clear directional bias. Opportunities exist in potential breakout scenarios at resistance levels, while support zones offer risk-managed entry points. For analysts, staying alert to macroeconomic factors that might influence these technical levels is crucial. Challenges are primarily tied to geopolitical events and their impacts on currency flows. Hence, traders should consider both technical indicators and external economic variables.
Smart Data Insight
Master the Perfect Entry & Exit for this Stock
Don't leave your profits to chance. Historically, this stock follows specific seasonal patterns that institutional traders use to maximize returns.
- ✅ Identify the "Golden Buying Window"
- ✅ Avoid high-risk correction cycles
- ✅ Backtested data from the last 20+ years