July 16, 2025 a 04:28 am

USDJPY: Trend and Support & Resistance Analysis
The USDJPY currency pair has demonstrated significant movements in recent months, showing various shifts between upward and downward trends. Overall, the current data suggests a strengthening of the Japanese Yen against the U.S. Dollar, with technical indicators implying potential continued trends. However, the volatility in the currency market presents both opportunities and risks for traders.
Trend Analysis
The analysis of USDJPY's recent closing prices reveals key trends guided by exponential moving averages. By observing the EMA20 and EMA50, we can infer the directional movement of the currency pair. An upward trend is suggested by EMA20 surpassing EMA50, whereas a downward trend is indicated when EMA20 is below EMA50. The relationship between these moving averages over the last period shows...
| Date | Closing Price | Trend |
|---|---|---|
| 16-Jul-2025 | 149.106 | ▲ Upward |
| 15-Jul-2025 | 148.831 | ▲ Upward |
| 14-Jul-2025 | 147.694 | ▲ Upward |
| 13-Jul-2025 | 147.373 | ▲ Upward |
| 11-Jul-2025 | 147.409 | ▲ Upward |
| 10-Jul-2025 | 146.229 | ▼ Downward |
| 09-Jul-2025 | 146.305 | ▼ Downward |
Technical analysis suggests that the overall shorter-term EMA has maintained above the longer-term EMA, indicating a ▲ upward momentum.
Support and Resistance
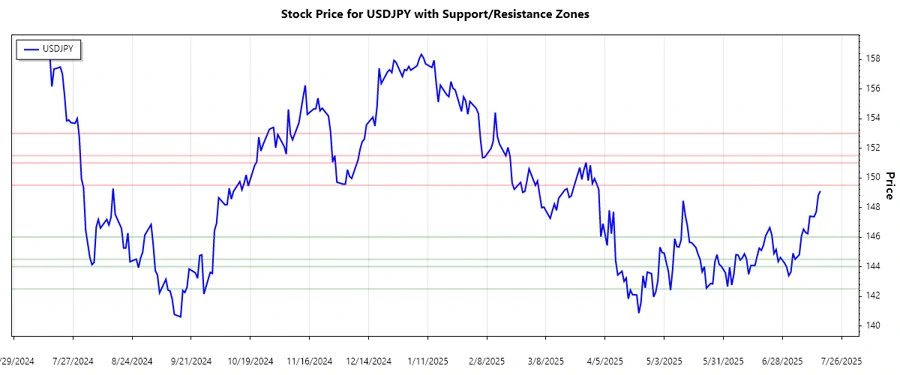
The evaluation of USDJPY identifies key support and resistance levels based on recent price activity. Support zones are regions where the price may find difficulty in falling below, while resistance zones are levels of difficulty for upward price movements. Our calculations show:
| Zone | From | To | Direction |
|---|---|---|---|
| Support 1 | 146.00 | 144.50 | ↓ |
| Support 2 | 144.00 | 142.50 | ↓ |
| Resistance 1 | 149.50 | 151.00 | ↑ |
| Resistance 2 | 151.50 | 153.00 | ↑ |
Currently, USDJPY is trading around 149.106, which places it just below the major resistance zone, potentially limiting its upward movement temporarily.
Conclusion
The USDJPY currency pair presents an intriguing scenario for currency traders. The recent upward trend suggests potential gains, yet the proximity to strong resistance levels indicates caution should be exercised. The duality in possibility—either breaking resistance levels or retracing back to support levels—provides a dynamic environment for strategic trading. Analysts should be watchful of economic indicators and news that might sway the trend further.
Smart Data Insight
Master the Perfect Entry & Exit for this Stock
Don't leave your profits to chance. Historically, this stock follows specific seasonal patterns that institutional traders use to maximize returns.
- ✅ Identify the "Golden Buying Window"
- ✅ Avoid high-risk correction cycles
- ✅ Backtested data from the last 20+ years