May 13, 2025 a 04:28 am

USDJPY: Trend and Support & Resistance Analysis
USDJPY has experienced significant fluctuations recently, reflecting changes in both the global economic outlook and investor sentiment. Currently, the currency pair is displaying a mixed trend, showcasing both potential for upside gains and downside risks. Investors should be cautious and keep an eye on upcoming economic data and geopolitical events that could further impact this currency's performance.
Trend Analysis
Over the last several months, USDJPY has experienced significant movements influenced by various economic factors. Calculating the EMA20 and EMA50 from the provided data helps assess the trend direction:
| Date | Close Price | Trend |
|---|---|---|
| 2025-05-13 | 145.81799 | ▼ |
| 2025-05-12 | 148.452 | ▲ |
| 2025-05-11 | 145.797 | ▼ |
| 2025-05-10 | 145.323 | ▼ |
| 2025-05-09 | 145.362 | ▼ |
| 2025-05-08 | 145.894 | ▼ |
| 2025-05-07 | 143.818 | ▼ |
The EMA analysis reveals a downtrend in the recent period as EMA20 is consistently below EMA50, indicating bearish market sentiment. Traders can consider short positions while waiting for potential trend reversals.
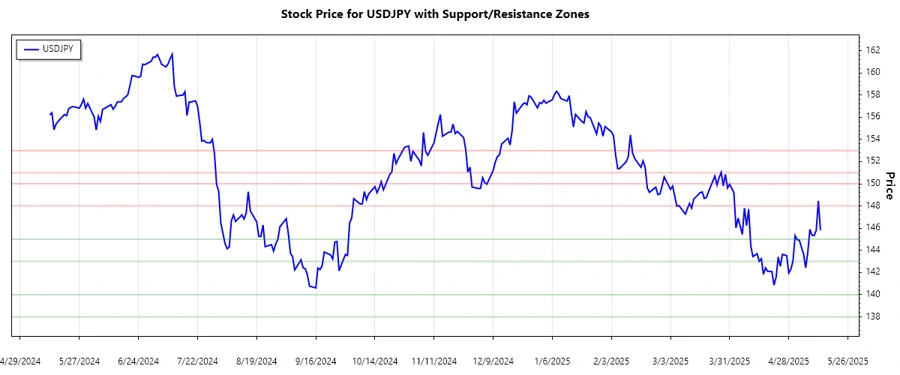
Support and Resistance
Based on historical closing prices, key support and resistance zones have been identified:
| Zone Type | From | To |
|---|---|---|
| Support 1 | 143.000 | 145.000 |
| Support 2 | 138.000 | 140.000 |
| Resistance 1 | 148.000 | 150.000 |
| Resistance 2 | 151.000 | 153.000 |
Currently, USDJPY is trading near the lower support zone, which could offer a buying opportunity if there is positive momentum. Traders should monitor these levels for potential breakouts or reversals.
Conclusion
In summary, USDJPY is currently experiencing a downtrend according to EMA analysis, with bearish sentiment dominating the market. Support and resistance zones provide potential trading opportunities depending on price action around these key levels. While the downside risk remains, any emerging bullish momentum could offer a reversal opportunity. Analysts should stay updated on macroeconomic developments and geopolitical tensions impacting the currency pair to make informed decisions.
Smart Data Insight
Master the Perfect Entry & Exit for this Stock
Don't leave your profits to chance. Historically, this stock follows specific seasonal patterns that institutional traders use to maximize returns.
- ✅ Identify the "Golden Buying Window"
- ✅ Avoid high-risk correction cycles
- ✅ Backtested data from the last 20+ years