
September 06, 2026 a 05:08 am

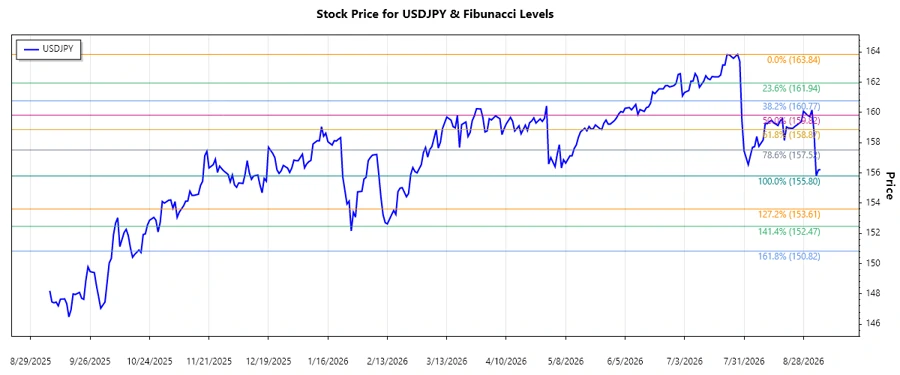
USDJPY: Fibonacci Analysis
The USDJPY currency pair has shown significant movements, reflecting global macroeconomic factors. Recently, the pair has been on a downward trend, prompting investors to revise their positions. With influences such as interest rate policies and economic data releases, the pair remains a focal point for currency traders. Overall, the recent price drop highlights the volatility and potential trading opportunities in this market.
Fibonacci Analysis
The recent trend in the USDJPY currency pair has been a downward movement. By analyzing this, we can establish key Fibonacci retracement levels and gain insights into possible future price actions.
| Details | Data |
|---|---|
| Start Date | 2026-07-28 |
| End Date | 2026-09-05 |
| High Price (Date) | 163.844 (2026-07-28) |
| Low Price (Date) | 155.797 (2026-09-03) |
| Fibonacci Level | Price Level |
|---|---|
| 0.236 | 161.999 |
| 0.382 | 160.572 |
| 0.5 | 159.821 |
| 0.618 | 159.069 |
| 0.786 | 157.938 |
The current price is around 156.196, suggesting it is near the major retracement level of 0.786, which typically acts as a strong support or resistance point. This indicates potential for reversal or consolidation in price movement.
The presence near this retracement level suggests that the USDJPY might find a support level here. Traders could see this as a point for potential buying opportunities, anticipating a possible reversal or at least a stabilization phase.
Conclusion
The analysis of the USDJPY reveals substantial chances and risks within the trading environment. As the pair navigates the complex landscape of global economic shifts, currency traders need to remain vigilant to macroeconomic indicators. While the recent downward trend hints at underlying bearish sentiment, Fibonacci retracement levels illuminate potential areas for reversal or consolidation. Analysts would do well to consider these technical indicators in alignment with fundamental analysis to grasp the full picture, ensuring robust decision-making.
Smart Data Insight
Master the Perfect Entry & Exit for this Stock
Don't leave your profits to chance. Historically, this stock follows specific seasonal patterns that institutional traders use to maximize returns.
- ✅ Identify the "Golden Buying Window"
- ✅ Avoid high-risk correction cycles
- ✅ Backtested data from the last 20+ years