January 31, 2026 a 05:08 am

USDJPY: Fibonacci Analysis
The USDJPY currency pair has shown a significant downward trend over the past few months. This decline can be attributed to various macroeconomic factors including interest rate changes and geopolitical tensions. With markets reacting to international developments, traders are advised to exercise caution. The overall sentiment remains bearish, and the technical indicators support the continuation of this trend.
Fibonacci Analysis
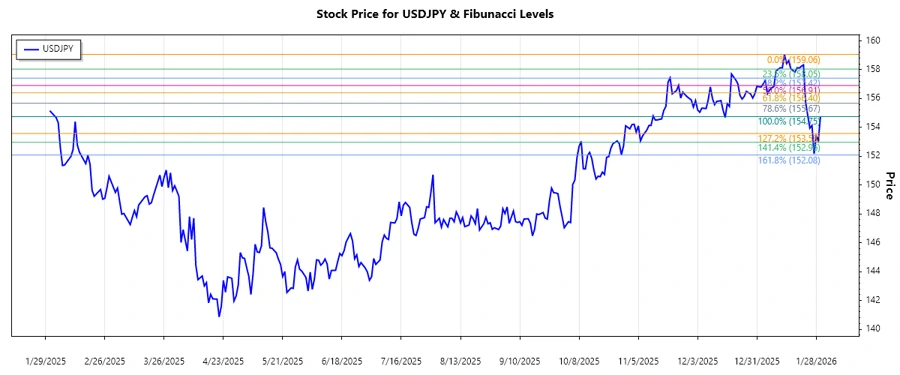
The recent data indicates a strong downward trend in the USDJPY currency pair from early January 2026 to late January 2026. The highest price within this period was on January 13, 2026, at 159.063, and the lowest was on January 30, 2026, at 154.75. Based on this high and low, several key Fibonacci retracement levels are calculated.
| Start Date | End Date | High Date | High Price | Low Date | Low Price |
|---|---|---|---|---|---|
| 2026-01-01 | 2026-01-30 | 2026-01-13 | 159.063 | 2026-01-30 | 154.75 |
| Fibonacci Level | Price Level |
|---|---|
| 0.236 | 157.962 |
| 0.382 | 157.347 |
| 0.5 | 156.907 |
| 0.618 | 156.467 |
| 0.786 | 155.828 |
The current price of USDJPY is below the 0.786 level at 154.75, indicating that it is not within a significant Fibonacci retracement zone. This suggests the potential for further downward movement, making the area around 156.467 to 155.828 a possible resistance zone.
Conclusion
The USDJPY has faced consistent pressure, exhibiting a clear downtrend over the analyzed period. With the current price not within a notable Fibonacci retracement, potential resistance levels are identified higher up the chart. While there may be short-term rebounds, the technical analysis suggests continued caution as the pair may break lower from these levels. Traders should watch for signs of reversal or strengthening of support before making strategic decisions.