October 04, 2025 a 05:08 am
USDJPY: Fibonacci Analysis
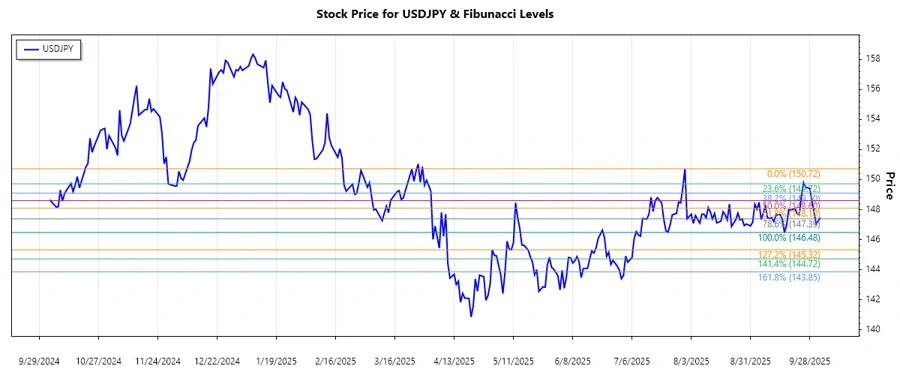
The USDJPY pair has seen a recent downward trend over the analyzed period. This currency pair is of significant interest as it reflects the economic interactions between the US and Japan. Investors are advised to keep a close eye on central bank announcements and economic data releases, which can substantially impact the USDJPY trajectory.
Fibonacci Analysis
| Information | Details |
|---|---|
| Start Date | 2025-07-31 |
| End Date | 2025-10-03 |
| High Price (Date) | 150.72 (2025-07-31) |
| Low Price (Date) | 146.477 (2025-09-16) |
| Fibonacci Level | Price |
|---|---|
| 0.236 | 147.597 |
| 0.382 | 148.488 |
| 0.5 | 149.046 |
| 0.618 | 149.604 |
| 0.786 | 150.298 |
The current price of 147.46 is close to the 0.236 retracement level. This indicates a possible weak support level and suggests a potential further drop if this level is breached.
Conclusion
The USDJPY appears to be in a bearish trend, as indicated by the Fibonacci retracement levels. While the 0.236 level could provide minor support, the overall trend suggests further declines might be in store. Analysts and traders must watch out for geopolitical events and macroeconomic indicators that could affect the market dynamics. The pair's break below significant support levels could imply bearish opportunities in the short term, but strategic positions should consider risk management due to potential volatility.
Smart Data Insight
Master the Perfect Entry & Exit for this Stock
Don't leave your profits to chance. Historically, this stock follows specific seasonal patterns that institutional traders use to maximize returns.
- ✅ Identify the "Golden Buying Window"
- ✅ Avoid high-risk correction cycles
- ✅ Backtested data from the last 20+ years