June 22, 2026 a 04:28 am

USDCHF: Trend and Support & Resistance Analysis
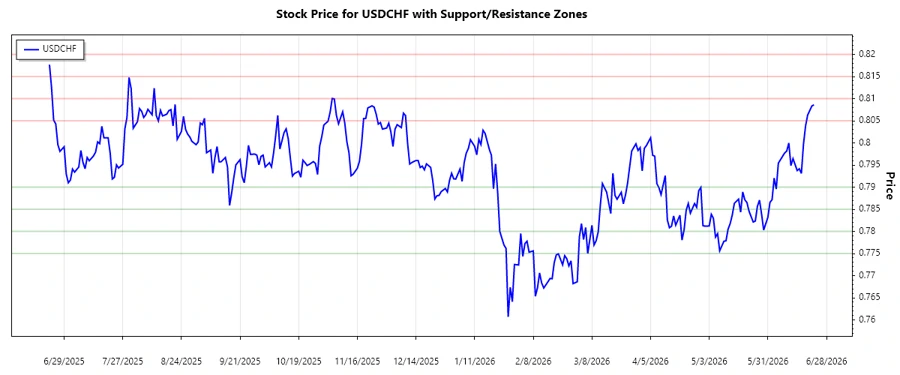
The currency pair USDCHF has exhibited fluctuations that highlight crucial support and resistance zones over the recent months. An evaluation of the exponential moving averages reveals a slight dominance of a particular trend. Investors closely monitoring this pair will find current analysis helpful in determining strategic entry and exit points based on recent price changes. Understanding the implications of these trends could significantly impact decision-making processes. Stay informed with the latest analytical insights to capture potential opportunities accurately.
Trend Analysis
Analyzing the daily closing prices for USDCHF over the last several months, the most current trend indicates an upward movement. Calculating the EMA20 and EMA50 reveals that the EMA20 is slightly above EMA50, signaling a moderate uptrend. Such configurations suggest a buying momentum within the market for this currency pair.
| Date | Closing Price | Trend |
|---|---|---|
| 2026-06-22 | 0.80861 | ▲ |
| 2026-06-21 | 0.80834 | ▲ |
| 2026-06-19 | 0.8063 | ▲ |
| 2026-06-18 | 0.80384 | ▲ |
| 2026-06-17 | 0.79971 | ▲ |
| 2026-06-16 | 0.7931 | ▲ |
| 2026-06-15 | 0.79415 | ▲ |
The latest trend analysis suggests buying interest is currently prominent. Investors should be mindful of any shift in these indicators, as they may negate the prevailing momentum.
Support- and Resistance
The USDCHF has encountered several levels that act as natural barriers to price movement. Analysis of support and resistance indicates key zones to watch for price reversal or continuation of current trends.
| Zone Type | Range | Indicator |
|---|---|---|
| Support | 0.78500 - 0.79000 | ▼ |
| Support | 0.77500 - 0.78000 | ▼ |
| Resistance | 0.80500 - 0.81000 | ▲ |
| Resistance | 0.81500 - 0.82000 | ▲ |
Currently, the closing price for USDCHF is approaching its resistance zone between 0.80500 to 0.81000. This suggests a potential area where a price reversal may occur, warranting close observation.
Conclusion
The USDCHF is showing signs of an upward trend, supported by recent analysis of the EMA indicators which highlight a buying momentum. As the price nears significant resistance zones, traders should remain cautious of possible pullbacks. Understanding these movements and their implications in the current market context is crucial for strategic planning. Investors should consider potential volatility and adjust their positions accordingly to mitigate risks. Advisors and analysts may find tactical opportunities through frequent assessments of these levels. By continuously monitoring these technical indicators, it becomes possible to make informed decisions that capitalize on emerging trends.
Smart Data Insight
Master the Perfect Entry & Exit for this Stock
Don't leave your profits to chance. Historically, this stock follows specific seasonal patterns that institutional traders use to maximize returns.
- ✅ Identify the "Golden Buying Window"
- ✅ Avoid high-risk correction cycles
- ✅ Backtested data from the last 20+ years