January 31, 2026 a 04:28 am
USDCHF: Trend and Support & Resistance Analysis
The USDCHF currency pair has recently encountered significant fluctuations. With historical data indicating varied trends, technical indicators show potential shifts in momentum. Analysts should monitor current levels for any signs of sustained movements, which could offer trading opportunities.
Trend Analysis
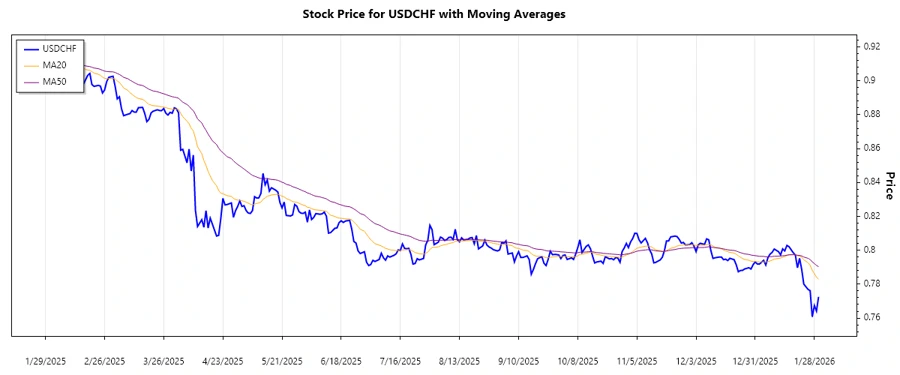
Over the analyzed period, USDCHF has exhibited a dominant downward trend. The calculated 20-day EMA remains below the 50-day EMA, indicating consistent bearish pressure. Here's a snapshot of the last seven days:
| Date | Close Price | Trend |
|---|---|---|
| 2026-01-30 | 0.77253 | ▼ |
| 2026-01-29 | 0.76412 | ▼ |
| 2026-01-28 | 0.76738 | ▼ |
| 2026-01-27 | 0.76069 | ▼ |
| 2026-01-26 | 0.77616 | ▲ |
| 2026-01-25 | 0.77692 | ▲ |
| 2026-01-23 | 0.78002 | ▲ |
Based on the EMA analysis, this bearish trend reflects potential further declines unless a pronounced support level is reached.
Support and Resistance
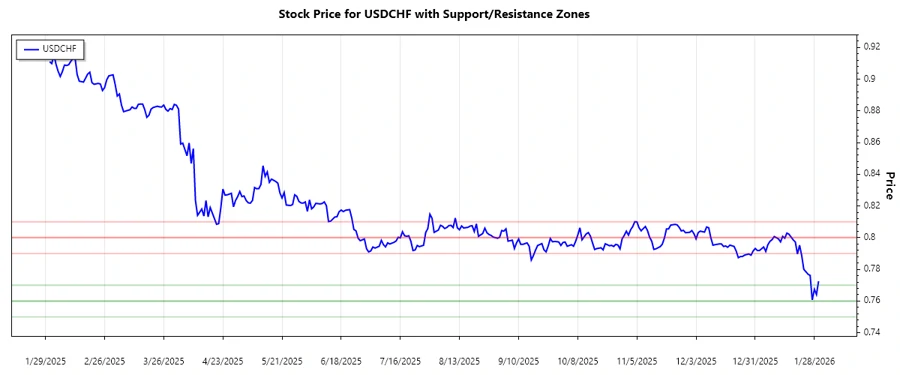
Significant support and resistance levels were identified by evaluating price action and technical thresholds:
| Zone Type | From | To |
|---|---|---|
| Support Zone 1 | ▼ 0.76000 | ▼ 0.77000 |
| Support Zone 2 | ▼ 0.75000 | ▼ 0.76000 |
| Resistance Zone 1 | ▲ 0.79000 | ▲ 0.80000 |
| Resistance Zone 2 | ▲ 0.80000 | ▲ 0.81000 |
The current price sits within the first support zone, signaling potential buying interest should the price stabilize.
Conclusion
USDCHF is experiencing a strong downward trend, backed by the sustained position of the EMA20 below the EMA50. The currency's presence within a support zone suggests potential stabilization, yet the lower trend persists. Traders should remain cautious and consider both support levels and wider market conditions when making decisions. Despite the bearish outlook, any reversal signified by EMA crossovers could present profitable opportunities.