January 09, 2026 a 04:28 am
USDCHF: Trend and Support & Resistance Analysis
The USDCHF currency pair showcases a complex landscape with recent fluctuations. Despite a few periods of stability, the overall trend requires cautious evaluation, especially considering the impact of global economic news and monetary policies. Understanding the underlying patterns and data can help in anticipating future movements and potential breakout points.
Trend Analysis
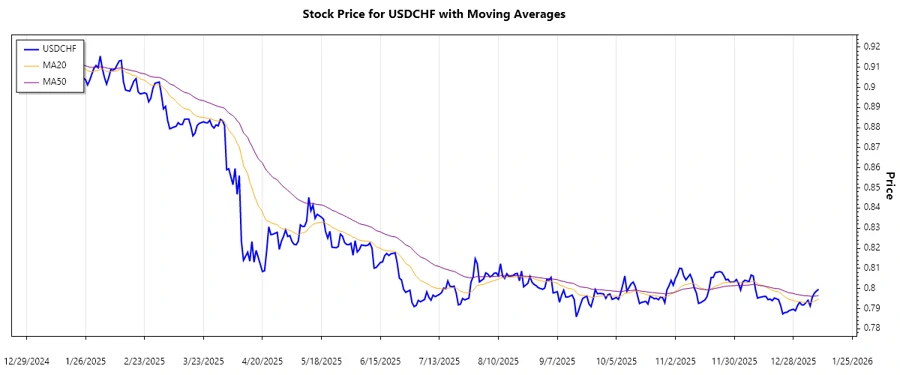
Based on the analysis of closing prices and exponentials moving averages (EMA), we observe the following data-driven insights. The last few weeks indicate moderate price shifts. Recent EMA calculations are essential to determine short and mid-term tendencies.
| Date | Close | Trend |
|---|---|---|
| 2026-01-09 | 0.79961 | ▼ Abwärtstrend |
| 2026-01-08 | 0.79875 | ▼ Abwärtstrend |
| 2026-01-07 | 0.79769 | ▼ Abwärtstrend |
| 2026-01-06 | 0.79556 | ▼ Abwärtstrend |
| 2026-01-05 | 0.79130 | ▼ Abwärtstrend |
| 2026-01-04 | 0.79410 | ▼ Abwärtstrend |
| 2026-01-02 | 0.79184 | ▼ Abwärtstrend |
The EMA20 and EMA50 both suggest a prevailing downtrend over the last analyzed days due to the sustained lower averages. This may indicate that bearish pressure continues to influence the USDCHF.
Support and Resistance
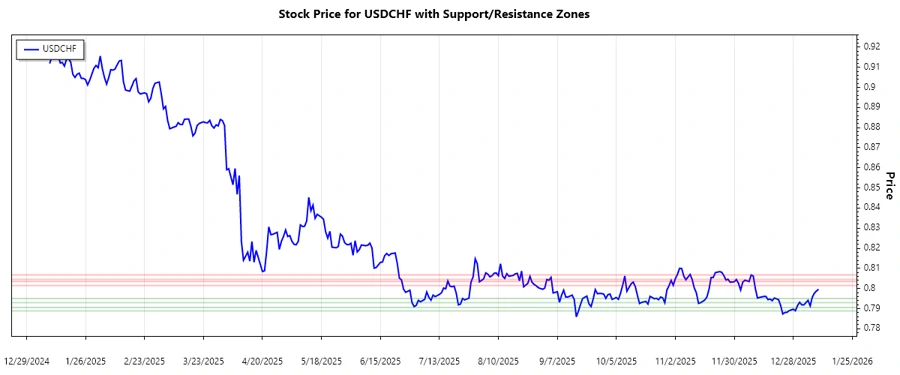
The USDCHF exchange rate reveals critical levels upon analysis of historical close prices, integral in potential reversal and breakout scenarios.
| Zone Type | Range |
|---|---|
| Support Zone 1 | 0.7889 - 0.7905 |
| Support Zone 2 | 0.7930 - 0.7950 |
| Resistance Zone 1 | 0.8015 - 0.8035 |
| Resistance Zone 2 | 0.8045 - 0.8068 |
Currently, the USDCHF pair navigates near the Support Zone 1, suggesting that bullish intervention might occur if further declines are halted here.
Conclusion
USDCHF's recent patterns suggest caution for traders and investors amid ongoing concerns about potential reversals. The identified support zones are crucial; however, they face challenges from prevailing market dynamics. Investors should keep a close eye on global economic signals that could further impact volatility and anticipated outcomes in currency markets.