December 06, 2025 a 04:28 am

USDCHF: Trend and Support & Resistance Analysis
The USDCHF currency pair has shown fluctuations over the past months, with a recent decline. The current technical analysis suggests a bearish trend, with the price fluctuating within established support and resistance zones. Analysts should monitor key levels for potential breakouts or reversals.
Trend Analysis
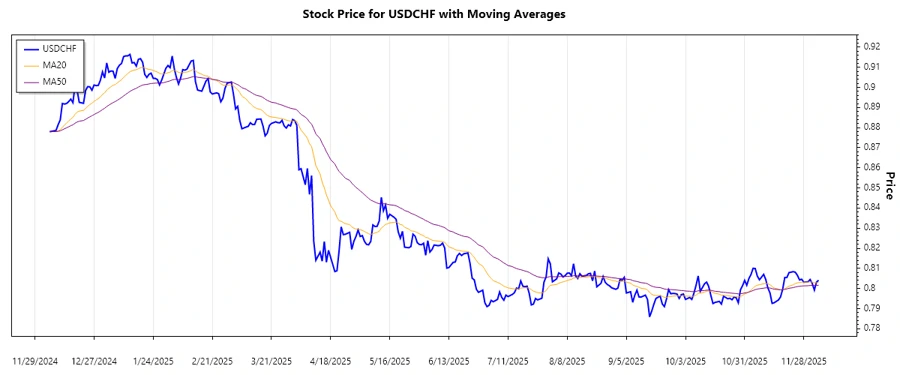
A detailed analysis of the USDCHF over recent months reveals a bearish trend. The EMA20 is currently below the EMA50, indicating downward momentum. However, price movements reflect a short-term stabilization within the lower range.
| Date | Close Price | Trend |
|---|---|---|
| 2025-12-05 | 0.80412 | ▼ |
| 2025-12-04 | 0.80314 | ▼ |
| 2025-12-03 | 0.7992 | ▼ |
| 2025-12-02 | 0.80248 | ▲ |
| 2025-12-01 | 0.80446 | ▲ |
| 2025-11-30 | 0.80336 | ▼ |
| 2025-11-28 | 0.80312 | ▼ |
The current trend suggests cautious optimism as the price attempts to recover. A break above key averages could indicate a reversal.
Support- and Resistance
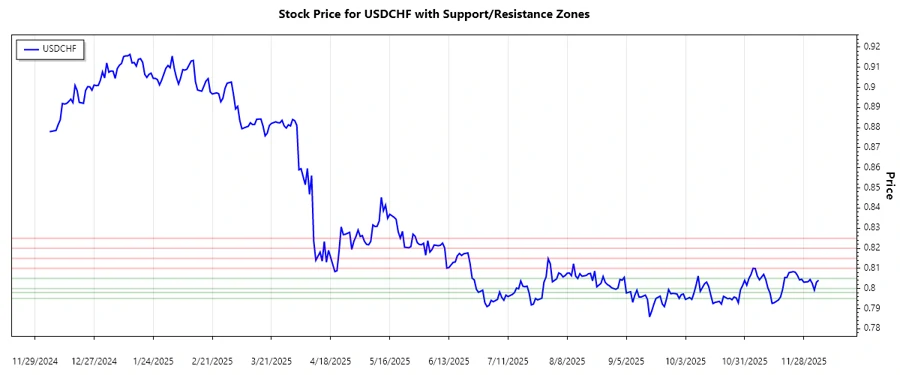
The analysis identifies key support and resistance zones. The market is near the lower support range, potentially providing a cushion for reversal efforts. Key resistance zones need to break for a clear upward move.
| Support Zone | Resistance Zone |
|---|---|
| 0.79500 - 0.79800 | 0.81000 - 0.81500 |
| 0.80000 - 0.80500 | 0.82000 - 0.82500 |
Currently, the USDCHF price is within the support zone, suggesting potential support against further declines. Monitoring momentum near these levels is crucial for confirming any shift.
Conclusion
The current analysis reflects a bearish undertone in the USDCHF currency pair, with important support at lower price levels providing a potential base. However, resistance zones remain a significant barrier for bulls. Short-term traders should be cautious, waiting for confirmation of a breakout or sustained support at these levels. Investors should weigh the potential risks of further declines against the opportunity for gains if key resistances break.