October 04, 2025 a 04:28 am
USDCHF: Trend and Support & Resistance Analysis
This analysis dives into the recent trends of the USDCHF currency pair. The exchange rate has been largely fluctuating over the months, influenced by various economic factors. Our current technical analysis will decipher these trends, alongside identifying critical support and resistance zones that short-term traders should monitor. This insight is particularly useful for investors focusing on currency trading strategies.
Trend Analysis
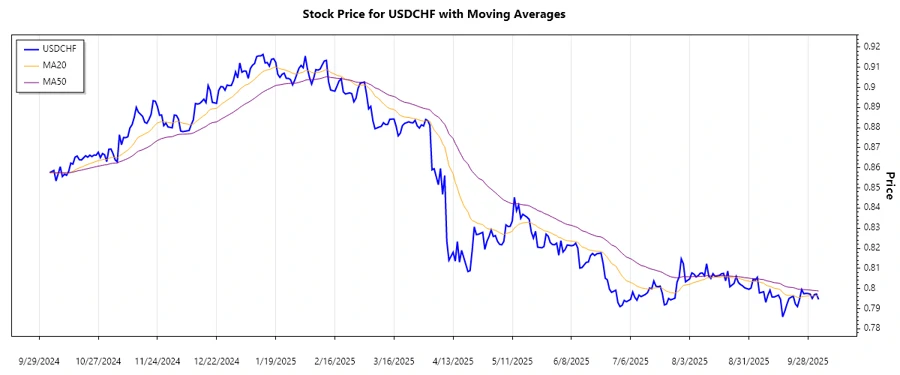
The USDCHF currency pair has exhibited dynamic price movements over the past months. Calculating the Exponential Moving Averages (EMAs), we see that for the most recent data, the EMA20 is slightly below the EMA50, suggesting a bearish trend. The analysis of the trend over the last seven days reveals:
| Date | Closing Price | Trend |
|---|---|---|
| 2025-10-03 | 0.79456 | ▼ |
| 2025-10-02 | 0.79724 | ▼ |
| 2025-10-01 | 0.79695 | ▼ |
| 2025-09-30 | 0.79506 | ▼ |
| 2025-09-29 | 0.79723 | ▼ |
| 2025-09-28 | 0.79748 | ▼ |
| 2025-09-27 | 0.79754 | ▼ |
From this data, the downward momentum is evident, suggesting traders consider short positions.
Support and Resistance
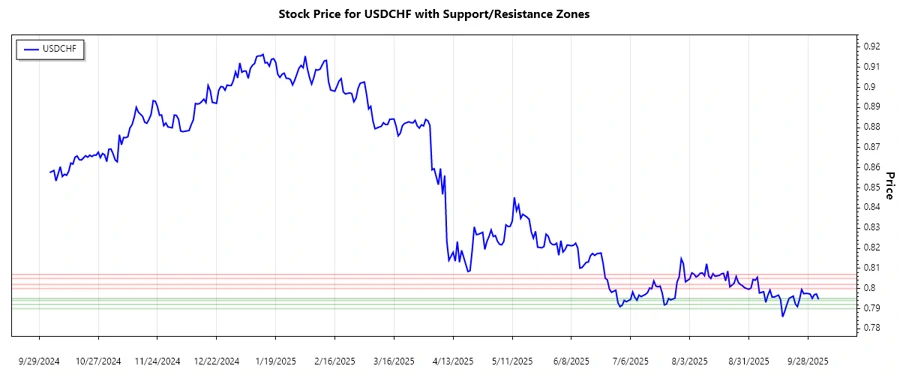
Analyzing the recent price data, two critical support and resistance zones have been identified:
| Zone Type | From | To |
|---|---|---|
| Support 1 | 0.7940 | 0.7950 |
| Support 2 | 0.7900 | 0.7920 |
| Resistance 1 | 0.8000 | 0.8020 |
| Resistance 2 | 0.8050 | 0.8070 |
Currently, the closing price is approaching the first support zone which suggests potential opportunities for reversal if a breakout does not occur.
Conclusion
The technical analysis of USDCHF indicates a prevailing bearish trend, supported by the positioning of the EMA20 below the EMA50. While current price action is navigating towards key support levels, further bearish activity may lead to a stronger move downwards if support levels are breached. However, traders should also remain vigilant for potential rebounds or corrections at these critical zones, indicating potential buying opportunities. Overall, while downside risks are evident, calculated entries and exits can still offer profitable opportunities for market participants.
Smart Data Insight
Master the Perfect Entry & Exit for this Stock
Don't leave your profits to chance. Historically, this stock follows specific seasonal patterns that institutional traders use to maximize returns.
- ✅ Identify the "Golden Buying Window"
- ✅ Avoid high-risk correction cycles
- ✅ Backtested data from the last 20+ years