July 15, 2025 a 04:28 am


USDCHF: Trend and Support & Resistance Analysis
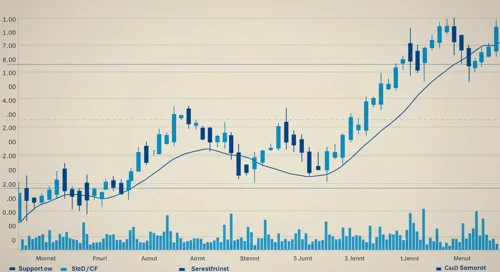
The USDCHF has experienced notable movements in recent months. Based on the calculated moving averages, there has been a shift in trend direction. Monitoring key support and resistance zones is essential to proactively manage potential turning points in the market.
Trend Analysis
| Date | Closing Price | Trend |
|---|---|---|
| 2025-07-15 | 0.79688 | ▼ |
| 2025-07-14 | 0.7979 | ▼ |
| 2025-07-13 | 0.79704 | ▼ |
| 2025-07-11 | 0.79597 | ▼ |
| 2025-07-10 | 0.7967 | ▼ |
| 2025-07-09 | 0.79416 | ▼ |
| 2025-07-08 | 0.79559 | ▼ |
Based on recent EMA calculations, the trend indicates a continuous downtrend as the EMA20 remains below the EMA50. This suggests the market sentiment is bearish.
Support and Resistance
| Zone Type | From | To |
|---|---|---|
| Support | 0.7900 | 0.7950 |
| Support | 0.7850 | 0.7900 |
| Resistance | 0.8000 | 0.8050 |
| Resistance | 0.8100 | 0.8150 |
The current price level is approaching the lower support zone, suggesting careful observation as a breakout or reversal might occur.
Conclusion
The USDCHF shows a prevailing downturn with opportunities for cautious entries at defined support levels. However, should the price fall below the support zones, an extended downward trend may unfold. Conversely, should the price rebound, the resistance levels may offer profitable exit points. As always, it's critical for analysts to weigh both technical signals and fundamental factors for a comprehensive market view.
Smart Data Insight
Master the Perfect Entry & Exit for this Stock
Don't leave your profits to chance. Historically, this stock follows specific seasonal patterns that institutional traders use to maximize returns.
- ✅ Identify the "Golden Buying Window"
- ✅ Avoid high-risk correction cycles
- ✅ Backtested data from the last 20+ years