
October 24, 2026 a 05:08 am
USDCHF: Fibonacci Analysis
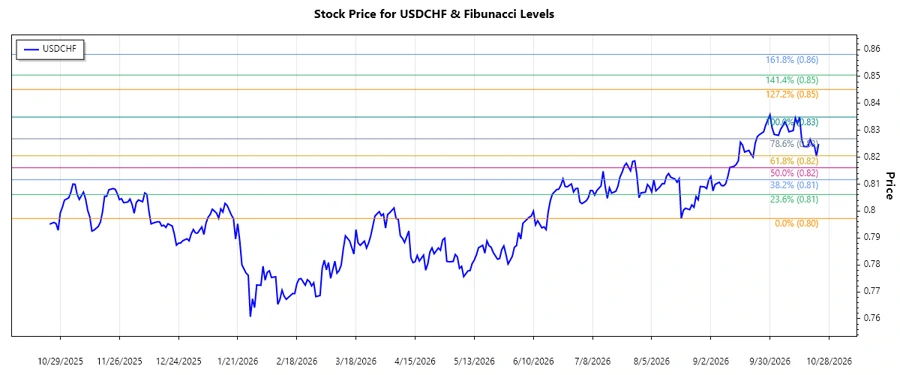
The USD/CHF forex pair has exhibited a noticeable upward trend over recent months. This movement reflects a bullish sentiment in the market, influenced by economic data and global financial conditions. By applying a Fibonacci retracement analysis to this trend, we can better understand potential support and resistance levels, offering insights into future price movements. This analysis is crucial for traders seeking strategic entry and exit points in a fluctuating market.
Fibonacci Analysis
| Feature | Details |
|---|---|
| Trend Start Date | 2026-08-18 |
| Trend End Date | 2026-10-23 |
| High Point (Price & Date) | 0.83492 on 2026-10-14 |
| Low Point (Price & Date) | 0.79725 on 2026-08-19 |
| Fibonacci Levels |
|
| Current Price | 0.82491 (as of 2026-10-23) |
| Retracement Zone | 0.786 |
| Technical Interpretation | The current price is approaching the 78.6% Fibonacci retracement level, indicating a potential resistance area. A break above this level might lead to testing previous highs, whereas failure to break could result in a pullback. |
Conclusion
The USD/CHF has been in a solid upward trajectory, indicative of strengthening USD or a weakening CHF or both. The proximity to a key Fibonacci retracement level suggests a critical juncture for the currency pair. Traders should be cautious as a break above the 78.6% level could signal further upside, potentially offering lucrative opportunities. Conversely, traders should be prepared for a possible bearish retracement if resistance holds. Overall, the analysis underscores the importance of remaining vigilant in monitoring economic indicators and market sentiment.
Smart Data Insight
Master the Perfect Entry & Exit for this Stock
Don't leave your profits to chance. Historically, this stock follows specific seasonal patterns that institutional traders use to maximize returns.
- ✅ Identify the "Golden Buying Window"
- ✅ Avoid high-risk correction cycles
- ✅ Backtested data from the last 20+ years