
September 25, 2026 a 05:08 am

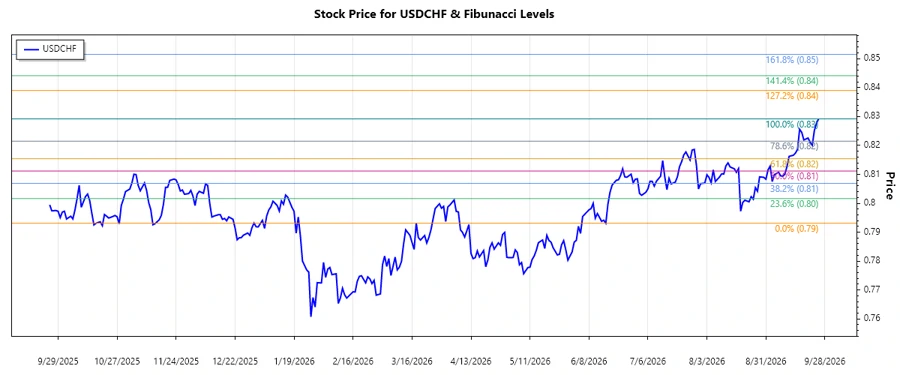
USDCHF: Fibonacci Analysis
The USD/CHF currency pair has exhibited significant price movements over the last several months. With a notable upward trend observed, traders are eyeing this pair for potential retracement opportunities. The long-term trajectory could indicate further strength of the USD against the CHF, but caution is advised as the market may face resistance at key Fibonacci levels.
Fibonacci Analysis
The recent price trend for USD/CHF reveals an upward trajectory starting from June 15, 2026, to September 25, 2026. During this period, the pair reached a low of 0.7931 on June 16, 2026, and a high of 0.8292 on September 25, 2026. Fibonacci retracement levels have been calculated to identify potential support and resistance zones.
| Parameter | Value |
|---|---|
| Start Date | 2026-06-15 |
| End Date | 2026-09-25 |
| High Price | 0.8292 (2026-09-25) |
| Low Price | 0.7931 (2026-06-16) |
| Fibonacci Level 0.236 | 0.8019 |
| Fibonacci Level 0.382 | 0.8083 |
| Fibonacci Level 0.5 | 0.8112 |
| Fibonacci Level 0.618 | 0.8141 |
| Fibonacci Level 0.786 | 0.8202 |
| Current Price | 0.8292 |
| Current Retracement Zone | none |
| Technical Interpretation | The current price trades above the highest Fibonacci level, suggesting continued bullish momentum. A pullback to these levels could provide buying opportunities. |
Conclusion
With the recent upward momentum in the USD/CHF currency pair, traders should watch for potential retracement to the calculated Fibonacci levels. This analysis suggests opportunities for traders to capitalize on support areas during pullbacks. However, a break below these levels may signal a change in trend, presenting risks. Technical analysts will find the recent price action and Fibonacci levels crucial for future trading strategies.
Smart Data Insight
Master the Perfect Entry & Exit for this Stock
Don't leave your profits to chance. Historically, this stock follows specific seasonal patterns that institutional traders use to maximize returns.
- ✅ Identify the "Golden Buying Window"
- ✅ Avoid high-risk correction cycles
- ✅ Backtested data from the last 20+ years