April 20, 2026 a 05:08 am
USDCHF: Fibonacci Analysis
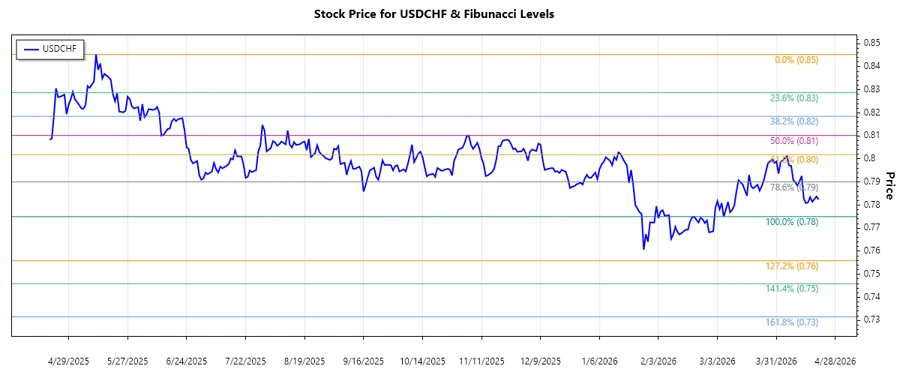
The USDCHF currency pair has shown fluctuations influenced by economic data, geopolitical tensions, and interest rate differentials. Recent movements reflect ongoing global market uncertainties and Swiss Franc's traditional haven appeal. Technical indicators suggest potential retracement zones important for traders.
Fibonacci Analysis
| Parameter | Details |
|---|---|
| Start Date | 2025-02-15 |
| End Date | 2026-03-06 |
| High Point | 0.84535 on 2025-05-12 |
| Low Point | 0.77501 on 2026-03-06 |
| Fibonacci Levels |
|
| Current Retracement Zone | None |
| Technical Interpretation | The USDCHF is below the 0.236 Fibonacci retracement level, suggesting potential for further downside movement before finding support. |
Conclusion
The USDCHF exchange rate analysis reveals that the pair has been on a consistent downward trend, which could continue unless significant economic shifts occur. Caution is advised as the pair approaches key support levels, with potential recovery fueled by market sentiment changes or economic data shifts. Traders should monitor central bank announcements and geopolitical events that could impact the currency pair. Understanding technical retracement zones will be crucial for strategic entry and exit points in the short term.