February 25, 2026 a 05:08 am

USDCHF: Fibonacci Analysis
The USDCHF currency pair has shown notable volatility, with recent months witnessing significant fluctuations in exchange rates. This analysis will delve into the latest trends and provide insights using Fibonacci retracement levels. The analysis aims to equip traders and financial analysts with a clearer understanding of potential market movements and key support/resistance levels.
Fibonacci Analysis
| Details | Value |
|---|---|
| Start Date | 2025-02-01 |
| End Date | 2026-02-25 |
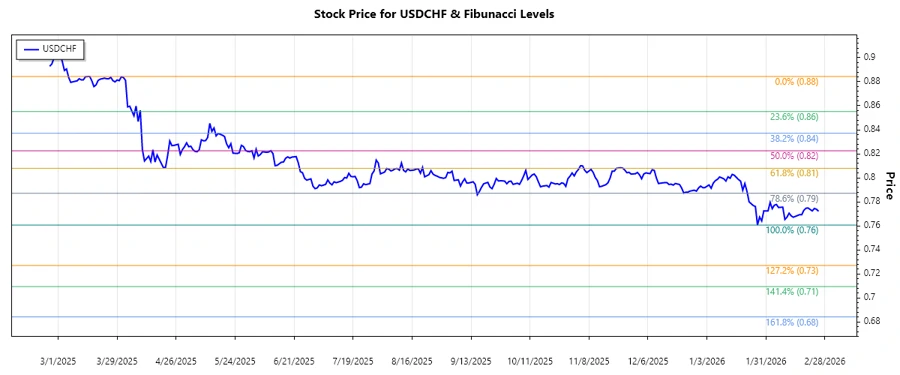
| High Point | 0.8843 on 2025-03-16 |
| Low Point | 0.76069 on 2026-01-27 |
| Fibonacci 0.236 Level | 0.78980 |
| Fibonacci 0.382 Level | 0.81392 |
| Fibonacci 0.5 Level | 0.82249 |
| Fibonacci 0.618 Level | 0.83106 |
| Fibonacci 0.786 Level | 0.84602 |
| Current Price | 0.77214 |
| Retracement Zone | None |
| Technical Interpretation | The current price of USDCHF is not within any key Fibonacci retracement levels, indicating potential further evaluation is needed to determine future movements. |
Conclusion
The USDCHF currency pair shows a lack of alignment with major Fibonacci levels, suggesting that the pair might continue its prevailing trend without immediate signs of reversal at this time. While the existing trend indicates an absence of retracement to significant levels, traders should remain cautious. Market conditions can change, and continuous monitoring of price action is essential. An understanding of broader economic factors and timely insights will be crucial for positioning in this currency pair. This analysis highlights the importance of technical indicators for making informed decisions in volatile markets.