November 15, 2025 a 05:08 am

USDCHF: Fibonacci Analysis
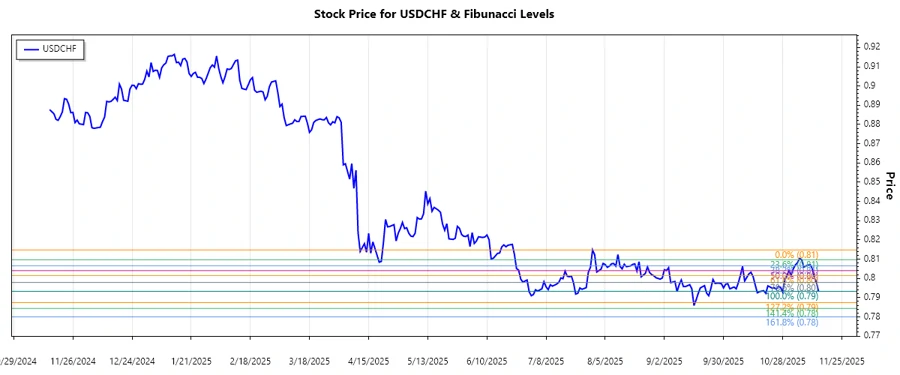
The USDCHF pair has shown notable fluctuations over the past months, influenced by global economic factors and market sentiment. Recent data highlights a downward trend, suggesting bearish momentum in this currency pair. Traders should watch for support levels as the pair navigates through potential retracement zones, hinting at possible rebounds.
Fibonacci Analysis
| Start Date | End Date | High Price | High Date | Low Price | Low Date |
|---|---|---|---|---|---|
| 2025-07-30 | 2025-11-14 | 0.81477 | 2025-07-30 | 0.79327 | 2025-11-14 |
| Level | Price |
|---|---|
| 0.236 | 0.80830 |
| 0.382 | 0.80526 |
| 0.5 | 0.80402 |
| 0.618 | 0.79878 |
| 0.786 | 0.79518 |
The current price of 0.79327 is within the 0.786 retracement area, indicating a potential support zone. Technically, this suggests a possibility for a temporary bullish correction.
Conclusion
USDCHF has been experiencing a downward trend, highlighting potential risks of further declines if support levels fail. However, the 0.786 Fibonacci level may serve as a formidable support, possibly offering reversal opportunities. Traders need to stay vigilant and consider both economic indicators and technical signals to capitalize on potential bullish corrections while managing risk effectively.
Smart Data Insight
Master the Perfect Entry & Exit for this Stock
Don't leave your profits to chance. Historically, this stock follows specific seasonal patterns that institutional traders use to maximize returns.
- ✅ Identify the "Golden Buying Window"
- ✅ Avoid high-risk correction cycles
- ✅ Backtested data from the last 20+ years