October 24, 2025 a 05:08 am
USDCHF: Fibonacci Analysis
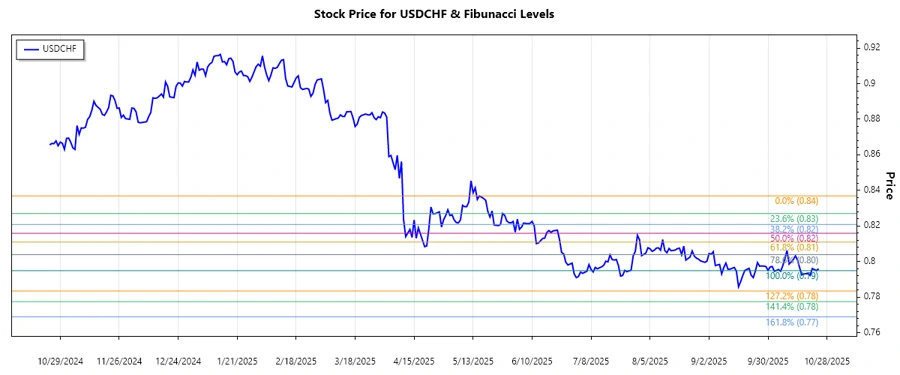
The USDCHF currency pair shows an overall downward trend in recent months, driven by economic factors affecting both the US dollar and Swiss franc. This analysis identifies key price levels through Fibonacci retracement, offering crucial insights for traders and investors.
Fibonacci Analysis
| Detail | Value |
|---|---|
| Start Date of Trend | 2025-05-19 |
| End Date of Trend | 2025-10-24 |
| High Price and Date | 0.83691 on 2025-05-19 |
| Low Price and Date | 0.79489 on 2025-10-23 |
| Fibonacci Levels |
|
| Current Retracement Zone | None |
| Technical Interpretation | USDCHF has remained below the 0.236 Fibonacci level, suggesting a persistent downtrend without significant retracement. This shows a lack of strong buying pressure among traders. |
Conclusion
Currently, USDCHF is in a dominant downtrend as highlighted by its inability to breach even the 0.236 Fibonacci level. While the currency pair might face periodic recoveries, persistent economic pressures remain a challenge. The risk of further depreciation seems higher unless significant economic shifts occur. Analysts must maintain a cautious stance and look for any emerging signals that might indicate a trend reversal.
Smart Data Insight
Master the Perfect Entry & Exit for this Stock
Don't leave your profits to chance. Historically, this stock follows specific seasonal patterns that institutional traders use to maximize returns.
- ✅ Identify the "Golden Buying Window"
- ✅ Avoid high-risk correction cycles
- ✅ Backtested data from the last 20+ years