August 08, 2025 a 05:08 am
USDCHF: Fibonacci Analysis
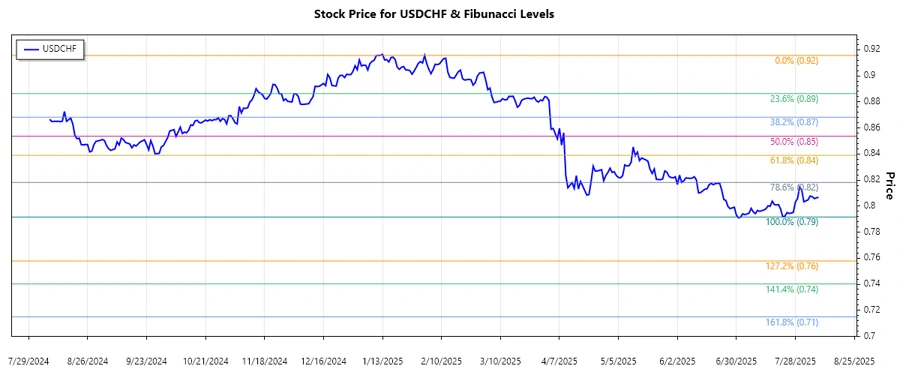
The USDCHF currency pair has shown a significant downtrend over the past few months. Investors are paying close attention to the recent price movements as the US economic outlook and Swiss franc's safe-haven status continue to influence market dynamics. Analyzing the trend through Fibonacci retracement levels can provide useful insights into potential support and resistance zones.
Fibonacci Analysis
| Aspect | Details |
|---|---|
| Trend Start Date | 2025-02-02 |
| Trend End Date | 2025-08-08 |
| High Price (Date) | 0.9156 (2025-02-02) |
| Low Price (Date) | 0.79161 (2025-07-02) |
Fibonacci Retracement Levels
| Level | Price |
|---|---|
| 0.236 | 0.82895 |
| 0.382 | 0.84663 |
| 0.5 | 0.85361 |
| 0.618 | 0.86059 |
| 0.786 | 0.87018 |
The current price is around 0.80669, which places it below the 0.236 retracement level, indicating that the currency is still struggling to recover from its recent lows. This suggests potential support in the lower price areas.
From a technical perspective, the USDCHF might find support near the 0.236 level. However, if it breaks below this level, further declines could be observed toward the recent lows.
Conclusion
The USDCHF currency pair is in a pronounced downtrend, with recent attempts to reverse failing. Fibonacci retracement levels indicate the potential for finding support at lower levels, but the currency remains vulnerable to continued downside momentum. Analysts should be cautious of further declines if the 0.236 support doesn't hold. Conversely, breaking above the 0.5 level could signal a more sustainable recovery. Overall, the current market conditions present risks for traders unless clear support or reversal signs emerge.
Smart Data Insight
Master the Perfect Entry & Exit for this Stock
Don't leave your profits to chance. Historically, this stock follows specific seasonal patterns that institutional traders use to maximize returns.
- ✅ Identify the "Golden Buying Window"
- ✅ Avoid high-risk correction cycles
- ✅ Backtested data from the last 20+ years