June 22, 2025 a 05:08 am
USDCHF: Fibonacci Analysis
The USDCHF currency pair has experienced notable fluctuations, reflecting global economic influences and central bank policies. Recently, significant volatility highlighted market instability. Monitoring further developments in economic indicators and geopolitical factors could impact trends.
Fibonacci Analysis
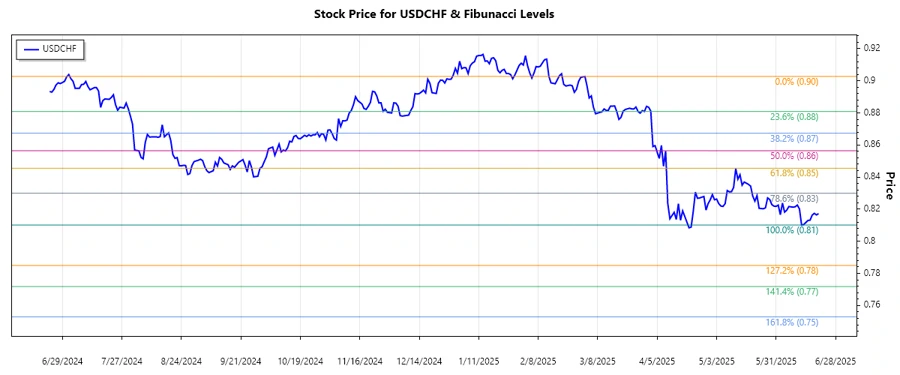
The analysis of USDCHF reveals a dominant downward trend in the given data. During this period, the high was documented at 0.9027 on February 2, 2025, while the low was recorded at 0.81012 on June 12, 2025. Applying the Fibonacci retracement levels to this downtrend, derived price levels will demonstrate potential reversal points.
| Fibonacci Level | Price |
|---|---|
| 0.236 | 0.8340 |
| 0.382 | 0.8443 |
| 0.5 | 0.8564 |
| 0.618 | 0.8685 |
| 0.786 | 0.8849 |
The current price of 0.81725 is within the 0.236 retracement zone. This suggests a potential stabilization area and could act as support.
Technically, this indicates a possible consolidation phase as the currency pair pauses in its decline, setting the stage for potential upward corrections if support levels hold.
Conclusion
In conclusion, the USDCHF's recent performance in the identified Fibonacci zone signals potential for price stabilization. While the downtrend dominance implies caution, opportunities for short-term gains through strategic trading remain. Analyst vigilance is essential, focusing on external economic cues and technical trend validations to mitigate risks and optimize trading decisions.
Smart Data Insight
Master the Perfect Entry & Exit for this Stock
Don't leave your profits to chance. Historically, this stock follows specific seasonal patterns that institutional traders use to maximize returns.
- ✅ Identify the "Golden Buying Window"
- ✅ Avoid high-risk correction cycles
- ✅ Backtested data from the last 20+ years