
October 25, 2026 a 04:28 am
USDCAD: Trend and Support & Resistance Analysis
The USDCAD currency pair has shown a notable price movement over recent months. The data suggests a fluctuating trend, indicative of market adjustments due to economic factors impacting both the US and Canadian economies. This analysis aims to decode the current price action, identifying significant trend shifts and potential support/resistance zones that traders should be aware of.
Trend Analysis
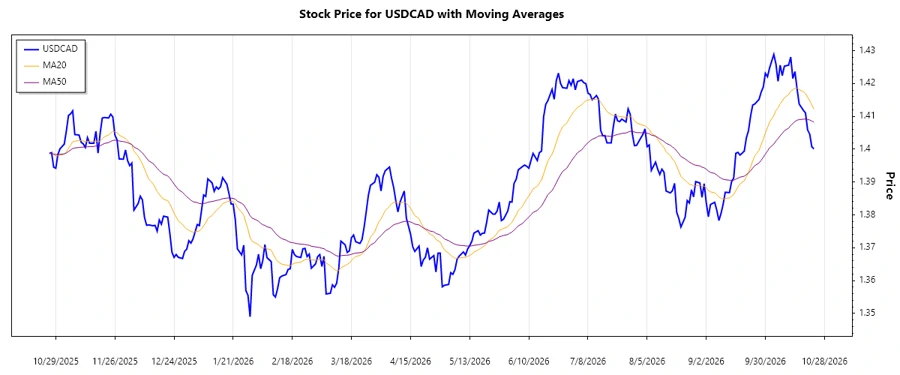
Utilizing the closing prices, the EMA20 and EMA50 were computed to gauge the prevailing trend in the USDCAD market. Based on the most recent data, the trend evaluation is as follows:
| Date | Close Price | Trend |
|---|---|---|
| 2026-10-23 | 1.40011 | ▼ |
| 2026-10-22 | 1.40072 | ▼ |
| 2026-10-21 | 1.40458 | ▼ |
| 2026-10-20 | 1.40587 | ▼ |
| 2026-10-19 | 1.41103 | ▼ |
| 2026-10-18 | 1.41184 | ▼ |
| 2026-10-16 | 1.41378 | ▼ |
The computed EMA20 is 1.40796, and the EMA50 is 1.40812. With EMA20 < EMA50, this configuration signals a prevailing downward trend (Abwärtstrend) in the market.
Support- and Resistance
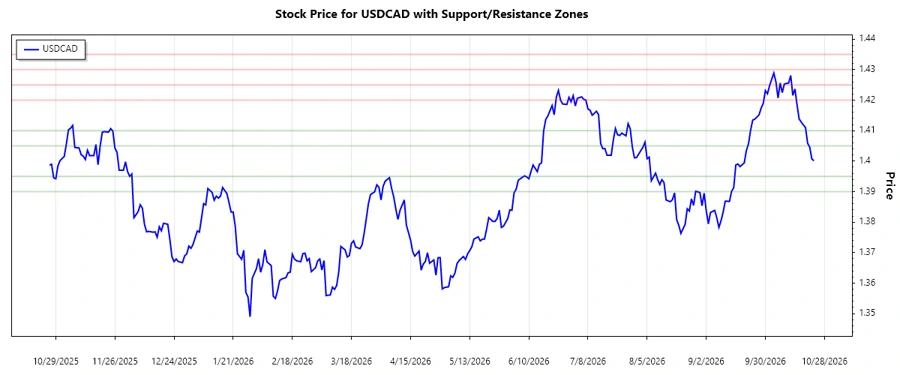
Several key support and resistance zones were identified based on the data. These levels can provide insight into potential price barriers and supports:
| Zone Type | From | To |
|---|---|---|
| Support Zone 1 | 1.39000 | 1.39500 |
| Support Zone 2 | 1.40500 | 1.41000 |
| Resistance Zone 1 | 1.42000 | 1.42500 |
| Resistance Zone 2 | 1.43000 | 1.43500 |
The current close is near the upper range of Support Zone 2 (1.40500 - 1.41000), suggesting the price could achieve an upward bounce within this area.
Conclusion
Currently, the USDCAD showcases a contraction indicative of a downward trend. This ongoing movement toward key support levels could yield opportunities for buyers if a reversal initiates. Conversely, breaking below these supports may validate continued declines. Analysts should monitor global economic signals impacting the dollar and loonie. Conducting careful assessments of key zones can empower traders with an edge in decision-making, nearly aligning with opportunities for entries or exits.
Smart Data Insight
Master the Perfect Entry & Exit for this Stock
Don't leave your profits to chance. Historically, this stock follows specific seasonal patterns that institutional traders use to maximize returns.
- ✅ Identify the "Golden Buying Window"
- ✅ Avoid high-risk correction cycles
- ✅ Backtested data from the last 20+ years