
October 16, 2026 a 04:28 am**USDCAD: Trend and Support & Resistance Analysis**
USDCAD: Trend and Support & Resistance Analysis
The recent price action in the USDCAD currency pair indicates a potential upward momentum. Over the past several months, the pair has experienced fluctuations that suggest increasing buyer interest. A detailed analysis of the trend lines and the moving averages will provide further insights into the underlying strength or weaknesses of this trend.
Trend Analysis
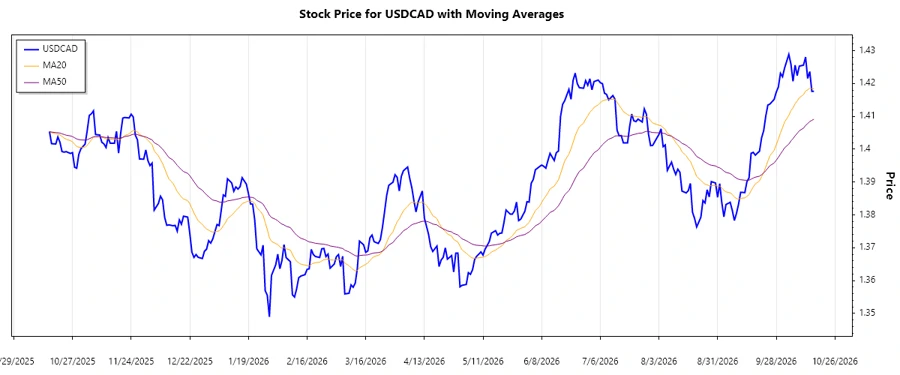
Upon analyzing the recent price data for USDCAD, the exponential moving averages (EMAs) were calculated. The EMA20 is currently above the EMA50, indicating an ongoing upwards trend. This suggests potential buying opportunities, especially in the context of the pair's current market dynamics.
| Date | Close | Trend |
|---|---|---|
| 2026-10-16 | 1.41763 | ▲ |
| 2026-10-15 | 1.41763 | ▲ |
| 2026-10-14 | 1.42365 | ▲ |
| 2026-10-13 | 1.42156 | ▲ |
| 2026-10-12 | 1.42808 | ▲ |
| 2026-10-11 | 1.42561 | ▲ |
| 2026-10-09 | 1.42531 | ▲ |
The continuing upward trend line is confirmed by the EMA crossover pattern. This pattern is generally indicative of sustained bullish momentum in trading strategies.
Support and Resistance
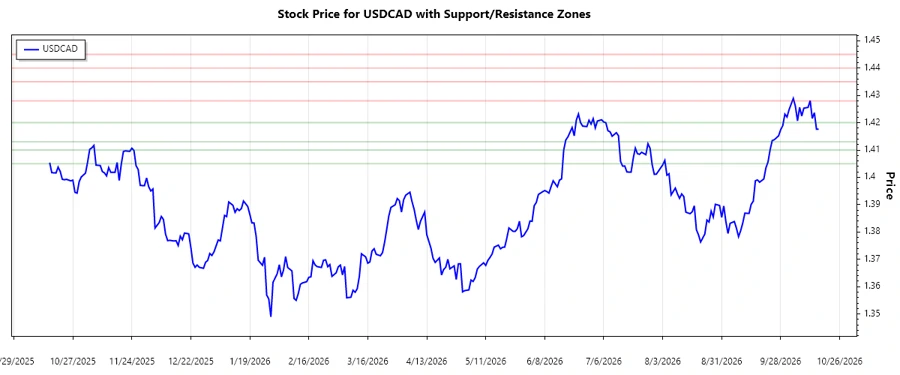
Using historical close prices, key support and resistance zones were identified. Two critical zones lie between 1.413 and 1.420 (support) and between 1.428 and 1.435 (resistance) respectively.
| Zone Type | From | To |
|---|---|---|
| Support | 1.413 | 1.420 |
| Support | 1.405 | 1.410 |
| Resistance | 1.428 | 1.435 |
| Resistance | 1.440 | 1.445 |
The current closing price of 1.41763 lies within the identified support zone, which historically offers a buy signal when paired with an upper crossing EMA pattern.
Conclusion
The USDCAD trading environment currently showcases an upward trend with multiple key support zones confirmed by the EMA indicator. These technical indicators favor bullish positions, with a cautious eye on resistance levels that might signal reversal points. While the trend remains bullish, traders should be vigilant for any sudden volume spikes or news-driven events that can sharply alter price direction and break established zones.
Smart Data Insight
Master the Perfect Entry & Exit for this Stock
Don't leave your profits to chance. Historically, this stock follows specific seasonal patterns that institutional traders use to maximize returns.
- ✅ Identify the "Golden Buying Window"
- ✅ Avoid high-risk correction cycles
- ✅ Backtested data from the last 20+ years