
September 22, 2026 a 04:28 am

USDCAD: Trend and Support & Resistance Analysis
The recent movement in the USDCAD pair indicates significant fluctuations as investors respond to geopolitical and economic developments. With global markets experiencing volatility, the currency has shown trends reflecting economic sentiments and speculative positions. Tracking the recent price action reveals patterns that align with broader market conditions.
Trend Analysis
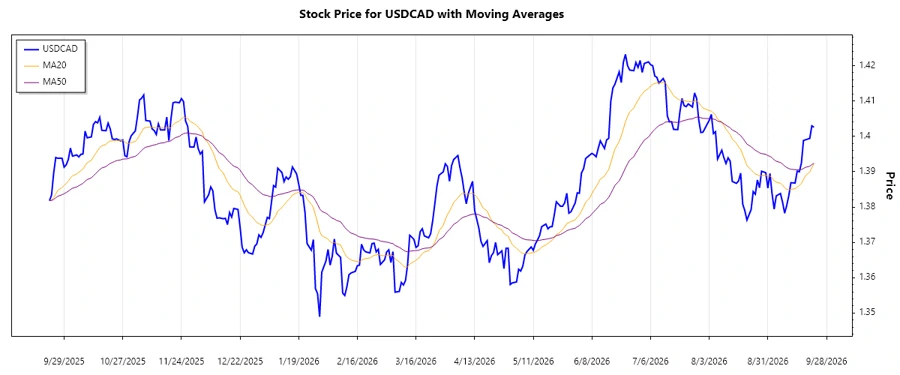
The analysis of the recent price movements in USDCAD reveals consistent fluctuations with recent tendencies indicating a bullish stance. The calculated EMAs show a possible trend adjustment over the period. A close look at the data suggests that the market sentiment is yet to settle on a definitive trajectory.
| Date | Closing Price | Trend |
|---|---|---|
| 2026-09-22 | 1.40256 | ▲ Bull |
| 2026-09-21 | 1.40297 | ▲ Bull |
| 2026-09-20 | 1.39941 | ▼ Bear |
| 2026-09-18 | 1.39903 | ▲ Bull |
| 2026-09-17 | 1.39882 | ▲ Bull |
| 2026-09-16 | 1.39240 | ▼ Bear |
| 2026-09-15 | 1.38997 | ▲ Bull |
The recent data trend indicates a shift towards a bullish (▲) sentiment, pointing towards potential upward movement in prices.
Support- and Resistance
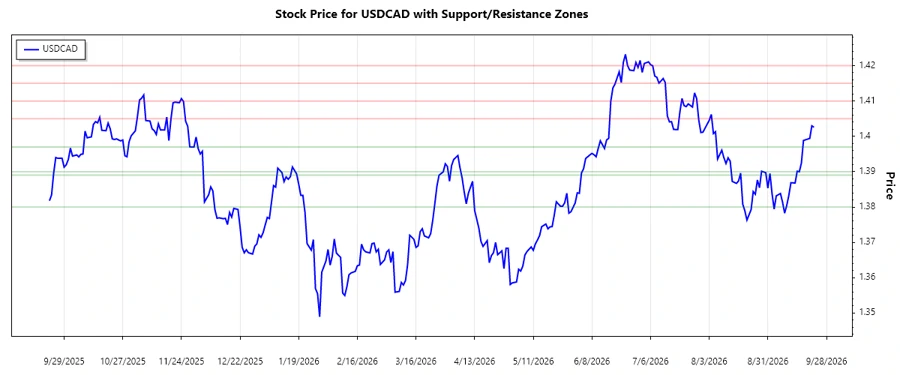
The analysis of the support and resistance levels provides insight into potential price boundaries. The recent data demonstrate crucial zones that guide potential buy or sell actions.
| Zone Type | Zone Range |
|---|---|
| Support Zone 1 | 1.39000 - 1.39700 |
| Support Zone 2 | 1.38000 - 1.38900 |
| Resistance Zone 1 | 1.40500 - 1.41000 |
| Resistance Zone 2 | 1.41500 - 1.42000 |
Currently, the USDCAD price is situated near a support zone, hinting at potential buying pressure. A move below this level could signal downward pressure.
Conclusion
The ongoing analysis of USDCAD suggests opportunities for both risk-averse and speculative traders. While current trends support potential bullish movements, the volatility inherent in the forex market might introduce unexpected shifts. Traders should monitor geopolitical developments and macroeconomic indicators that often influence forex dynamics. Emphasizing technical and fundamental factors will be crucial for positioning advantageously.
Smart Data Insight
Master the Perfect Entry & Exit for this Stock
Don't leave your profits to chance. Historically, this stock follows specific seasonal patterns that institutional traders use to maximize returns.
- ✅ Identify the "Golden Buying Window"
- ✅ Avoid high-risk correction cycles
- ✅ Backtested data from the last 20+ years