
June 28, 2026 a 04:28 am

USDCAD: Trend and Support & Resistance Analysis
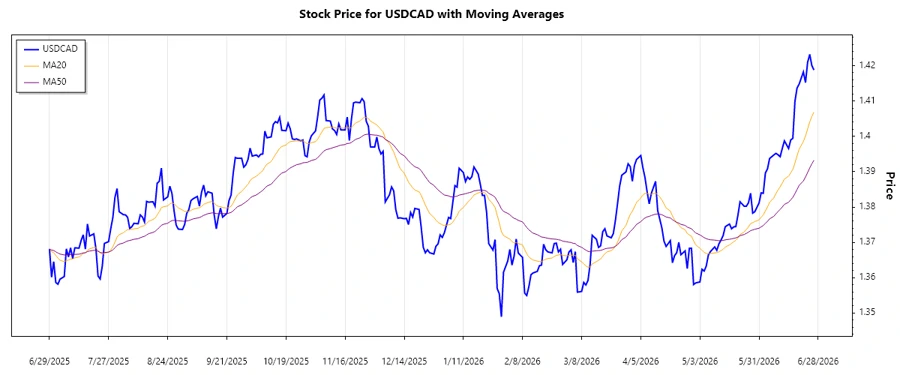
The USDCAD exchange rate has shown significant recent movement, indicating strong market interest. Technical indicators suggest a notable trend change could be underway. By examining the moving averages and key levels, traders can better understand potential future price movements.
Trend Analysis
Recent USDCAD trading data shows a dynamic trend in the market. Upon calculating the exponential moving averages (EMA) based on the closing prices, the last seven days' trend reveals:
| Date | Close Price | Trend |
|---|---|---|
| 2026-06-26 | 1.41875 | ▲ Uptrend |
| 2026-06-25 | 1.42002 | ▲ Uptrend |
| 2026-06-24 | 1.42318 | ▲ Uptrend |
| 2026-06-23 | 1.42094 | ▲ Uptrend |
| 2026-06-22 | 1.41521 | ▲ Uptrend |
| 2026-06-21 | 1.41823 | ▲ Uptrend |
| 2026-06-19 | 1.41479 | ▲ Uptrend |
The EMA20 currently exceeds EMA50, indicating a strong upward trend. This suggests potential bullish momentum that traders might consider capturing.
Support- and Resistance
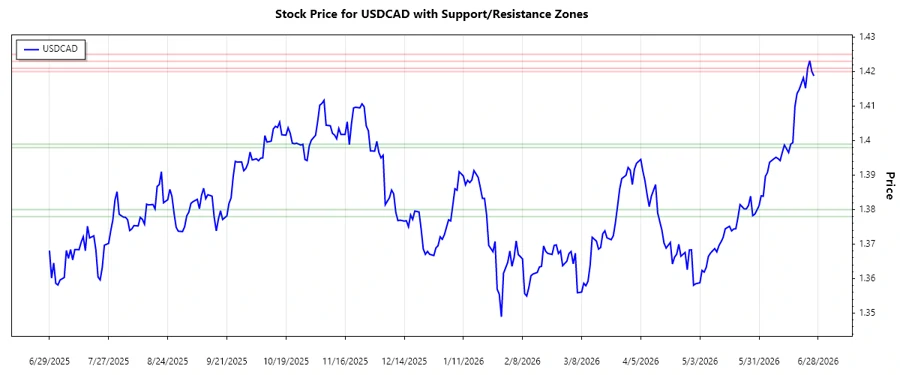
Key support and resistance levels have been identified based on historical data. These zones can indicate potential reversal or breakout points in price movement:
| Zone Type | From | To |
|---|---|---|
| Support Zone 1 | 1.39800 | 1.39900 |
| Support Zone 2 | 1.37800 | 1.38000 |
| Resistance Zone 1 | 1.42000 | 1.42100 |
| Resistance Zone 2 | 1.42300 | 1.42500 |
The current price level lies near the identified resistance zone, which suggests a possible price reaction or a continuation of the uptrend if breached.
Conclusion
In summary, the USDCAD pair exhibits a strong upward trend with potential continuation, given that the EMA20 exceeds EMA50. However, the proximity to the resistance zones might present challenges for further upward movement. Traders should consider both technical and fundamental factors when making trading decisions. Current market conditions suggest favorable opportunities for bullish trades, while also remaining cautious of potential pullbacks at resistance levels.
Smart Data Insight
Master the Perfect Entry & Exit for this Stock
Don't leave your profits to chance. Historically, this stock follows specific seasonal patterns that institutional traders use to maximize returns.
- ✅ Identify the "Golden Buying Window"
- ✅ Avoid high-risk correction cycles
- ✅ Backtested data from the last 20+ years