December 13, 2025 a 04:28 am

USDCAD: Trend and Support & Resistance Analysis
The USDCAD currency pair has shown varying trends over several months. As of the latest data, the USDCAD is exhibiting a moderate downtrend, characterized by fluctuating support and resistance levels. The calculated EMAs suggest a downward tendency, which may hint at potential bearish movements in the short to medium term.
Trend Analysis
Analyzing the USDCAD trends using the last set of closing prices, we compute the EMA20 and EMA50 to discern market direction. Calculations indicate:
| Date | Close Price | Trend |
|---|---|---|
| 2025-12-12 | 1.37695 | ▼ Down |
| 2025-12-11 | 1.37683 | ▼ Down |
| 2025-12-10 | 1.37922 | ▼ Down |
| 2025-12-09 | 1.38456 | ▼ Down |
| 2025-12-08 | 1.38569 | ▼ Down |
| 2025-12-07 | 1.38347 | ▼ Down |
| 2025-12-05 | 1.38142 | ▼ Down |
The recent EMA calculations depict a downward trend. With EMA20 < EMA50, the market shows a bear trend, advising caution with potential sell positions.
Support and Resistance
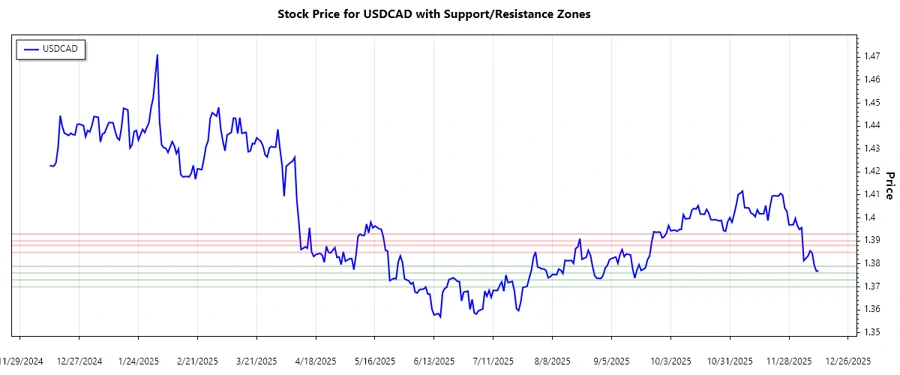
Evaluating the charts, we've identified two critical support and resistance zones from recent price actions:
| Zone Type | From | To |
|---|---|---|
| Support 1 | 1.37600 | 1.37900 |
| Support 2 | 1.37000 | 1.37300 |
| Resistance 1 | 1.38500 | 1.38800 |
| Resistance 2 | 1.39000 | 1.39300 |
Currently, the price hovers within the support zone 1, suggesting potential for a bottom line defense. Monitor for breakthroughs which could guide the next course of action.
Conclusion
Analyzing the current position of USDCAD, the pair appears to be in a bearish trend with significant implications should it break through the established support zones. Risks involve further declines, whereas opportunities lie in a potential reversal rally if supports hold. Strategic monitoring and responsive decision-making are advised to capitalize on possible reversals or continuation trends.