November 19, 2025 a 04:28 am


USDCAD: Trend and Support & Resistance Analysis
The recent price action of USDCAD exhibits significant stability with a slight upward bias. The interplay of EMAs suggests the imminent possibility of a sustained trend direction, highlighting the importance of monitoring the upcoming sessions. Investors and analysts should prioritize support and resistance zones to gauge potential entry and exit points effectively.
Trend Analysis
| Date | Close Price | Trend |
|---|---|---|
| 2025-11-19 | 1.39977 | ⚖️ |
| 2025-11-18 | 1.39882 | ⚖️ |
| 2025-11-17 | 1.40545 | ⚖️ |
| 2025-11-16 | 1.40182 | ⚖️ |
| 2025-11-14 | 1.40182 | ⚖️ |
| 2025-11-13 | 1.40354 | ⚖️ |
| 2025-11-12 | 1.40053 | ⚖️ |
The analysis of the recent trend indicates a sideways movement as denoted by the nearly equal EMAs. This consolidation phase might precede a breakout, and thus, traders should be vigilant for any technical signals that might indicate a new directional trend.
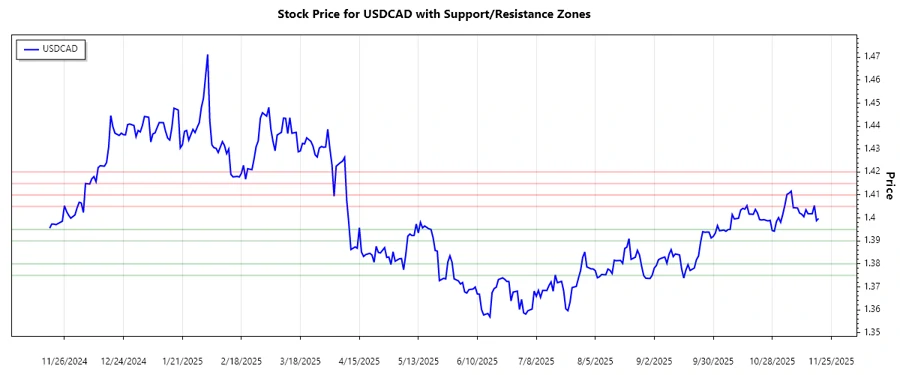
Support and Resistance
| Zone Type | Range | Indicator |
|---|---|---|
| Support | 1.3900 - 1.3950 | 🟢 |
| Support | 1.3750 - 1.3800 | 🟢 |
| Resistance | 1.4050 - 1.4100 | 🔴 |
| Resistance | 1.4150 - 1.4200 | 🔴 |
Currently, the USDCAD is trading within the lower range of its support zone, suggesting a potential rebound upon firm trading momentum. Analysts should observe whether the currency pair can breach the identified resistance levels to confirm a bullish turn.
Conclusion
The USDCAD is poised in a technical equilibrium with potential fluctuations influenced by support and resistance levels. Investors should remain cautious as the pair consolidates, looking for signs of breakout or breakdown. Given the technical analysis, those in the market should weigh their positions to capitalize on the upcoming movements while managing downside risk judiciously. This phase offers both opportunities for profit as well as precautionary tales of unpredictability in market direction.
Smart Data Insight
Master the Perfect Entry & Exit for this Stock
Don't leave your profits to chance. Historically, this stock follows specific seasonal patterns that institutional traders use to maximize returns.
- ✅ Identify the "Golden Buying Window"
- ✅ Avoid high-risk correction cycles
- ✅ Backtested data from the last 20+ years